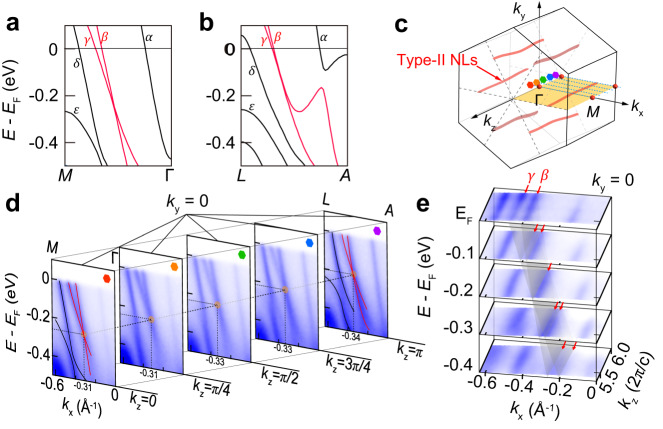
Fig. 3. The type-II Dirac nodal lines in RbTi3Bi5.
a, b Calculated bulk bands along Γ-M and L-A, respectively. The α-ε mark the first to fifth band from Γ to M point. The β and γ bands forming type-II Dirac cone are highlighted by red lines. c Schematic of momentum locations of type-II Dirac nodal lines (red curves, extracted from the calculation in Supplementary Fig. 7) and cut lines along different kz position (blue dash lines) in the bulk BZ. d ARPES intensity plots cut along the - direction at selected kz positions with photon energies region from 57~66 eV (kz = π, 3π/4, π/2, π/4 and 0). Orange dots denote the position of type-II Dirac nodes. e The stacking constant energy kx-kz maps along - direction taken at selected energies (EF to EF-0.4 eV). The red arrows denote the γ and β bands, the grey planes denote the 3D band dispersion along kz direction. The c in kz unit represents the out-of-plane lattice constant.

