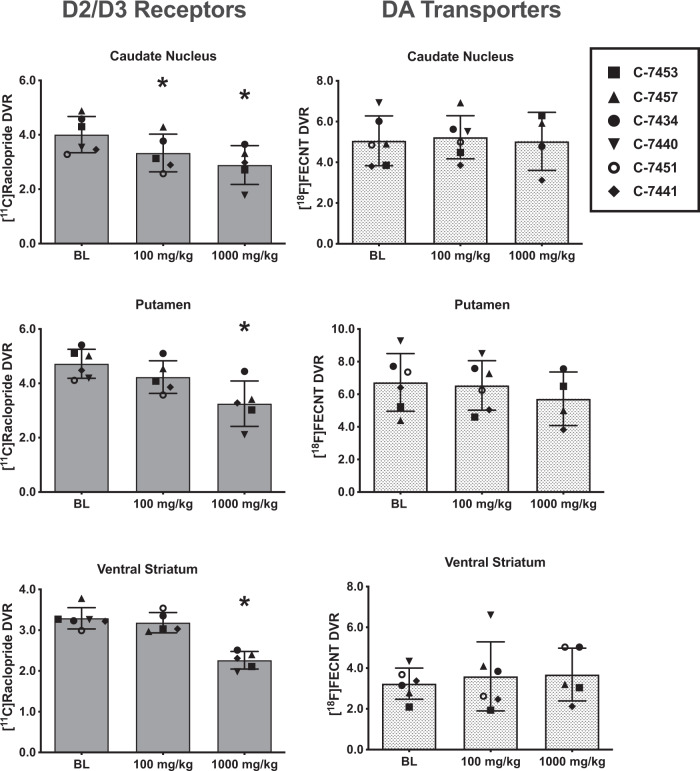
Fig. 1. Changes in [11C]raclopride (left panels) and [18F]FECNT (right panels) DVRs as a function of cocaine intake.
Data represent the mean (±SEM) from N = 5 at both 100 and 1000 mg/kg cocaine intakes for D2/D3 receptors and N = 6 and 4 for DA transporters following 100 and 1000 mg/kg self-administration, respectively. Baseline (BL) scans occurred prior to any cocaine exposure. Data points within each bar represents individual subjects. *p < 0.05.

