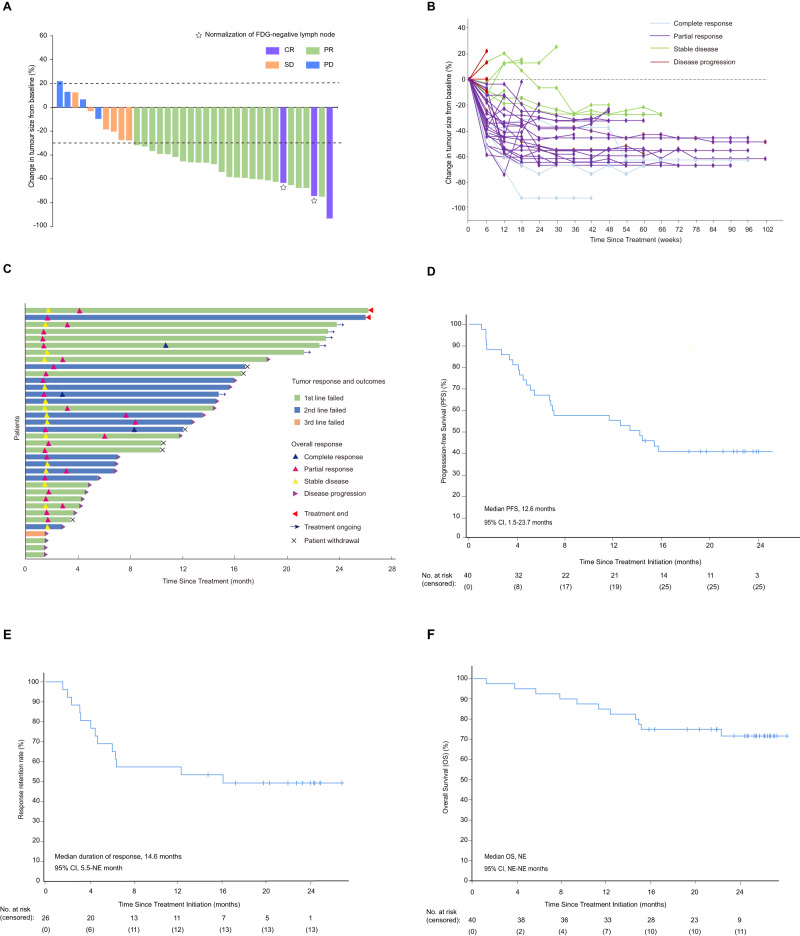
Fig. 1. Overall response and survival of platinum-resistant NPC patients (cohort 1).
A Waterfall plot of the best response in platinum-resistant NPC patients. Best change in the sum of target lesion size compared with that at baseline (n = 36). The horizontal lineat −30 shows the threshold for defining an objective response in the absence of non-target disease progression or new lesions according to RECIST 11. One patient with 100% reduction in target lesion size had non-target lesions present. White stars, two patients had normalization (<10 mm) of fluor-8-deoxyglucose (FDG)-negative lymph nodes (at baseline, lymph nodes were >1.5 cm and FDG+) and 100% reduction of non-lymph node lesions and are considered to have had a CR (purple bar). B Spider plot of measurements of target lesions at each timepoint in platinum-resistant NPC patients (n = 36). C Swimmer plot (n = 36). D Kaplan–Meier curves for progression-free survival. E Response retention rate in platinum-resistant NPC patients. F Kaplan–Meier curves for overall survival.

