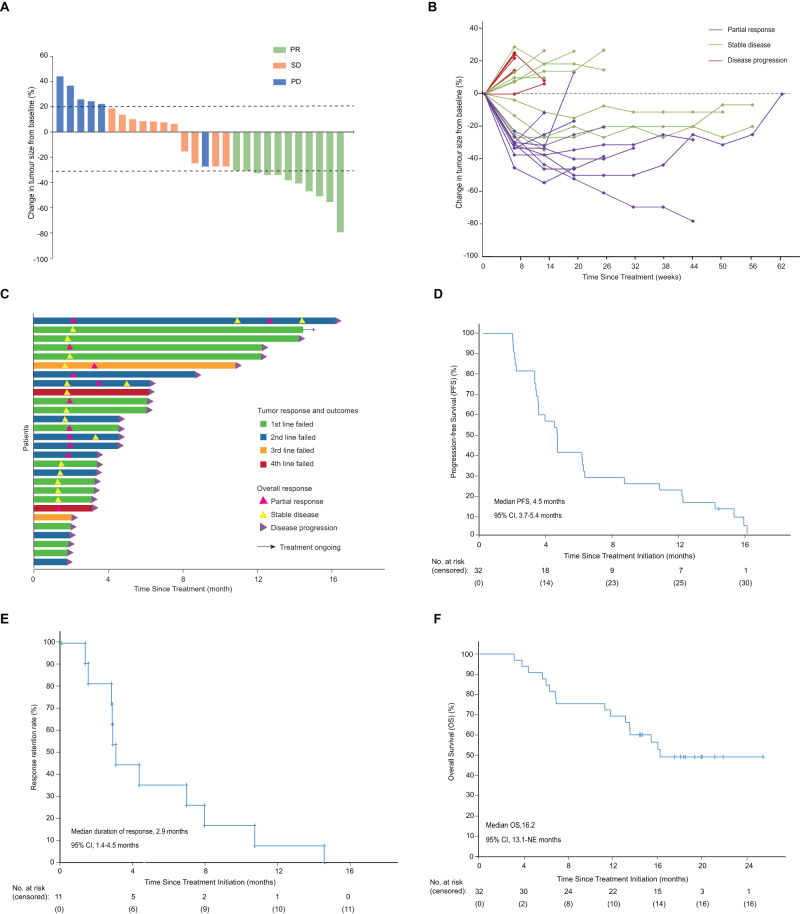
Fig. 2. Overall response and survival of PD-1 antagonist-resistant NPC (Cohort 2).
A Waterfall plot of the best response in PD-1 antagonist-resistant NPC patients (n = 28). B Spider plot of measurements of target lesions at each time point in PD-1 antagonist-resistant NPC patients (n = 28). C Swimmer plot (n = 28). D Kaplan–Meier curves for progression-free survival. E Response retention rate in PD-1 antagonist-resistant NPC patients. F Kaplan–Meier curves for overall survival.

