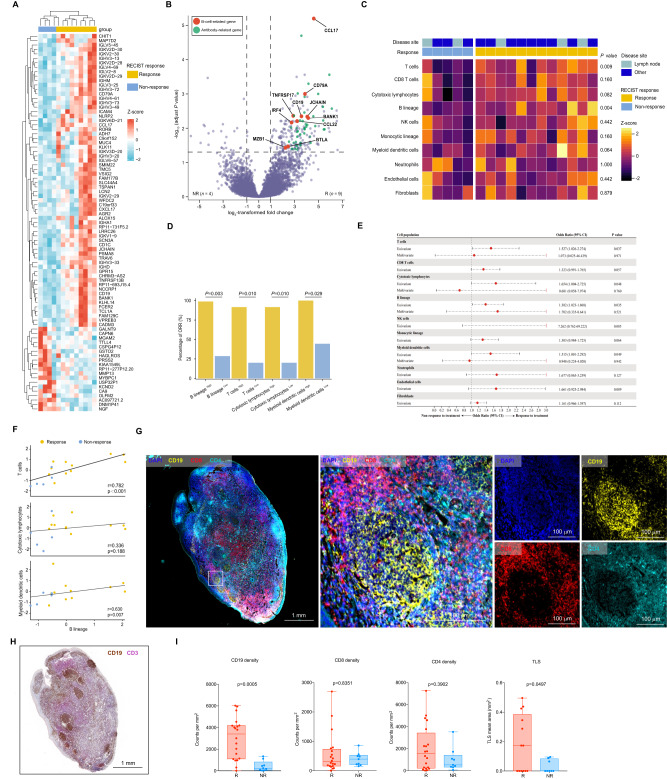
Fig. 3. TLSs containing B cells are predictive of clinical response to camrelizumab plus apatinib in platinum-resistant NPC patients.
A Supervised hierarchical clustering of differentially expressed genes (DEG) on RNA-seq analysis by response of nasopharyngeal carcinoma tumor specimens at baseline, with responder defined as having a complete or partial response by RECIST 1.1 and non-responder as having less than partial response (n = 4 non- responders and 9 responders). A cut-off of gene expression fold change of ≥2 or ≤−2 and a false discovery rate (FDR) q ≤ 0.05 was applied to select DEGs. B Volcano plot of differentially expressed genes from baseline tumor specimens by response (n = 4 non-responders and 9 responders). The x-axis in volcano plots depicts log2-transformed fold changes (FC) of Rs versus NRs. The vertical dashed lines represent the log2-transformed FC thresholds of 1 or −1. The horizontal dashed line represents the two-sided DESeq2-adjusted P value threshold of 0.05. B-cell-related genes (red) and antibody-related genes (green) are distinguished by colors. Both genes met the following criteria: log2-transformed FC> 2 or <−2 and a DESeq2-adjusted P value of <0.05. C Association between objective response rate (ORR, percentage) and MCP score at cutoff mean values, P values calculated by two-sided Fisher’s exact test. D Unsupervised hierarchical clustering analysis shown for baseline tumor specimens by response (n = 12 Rs and 5 NRs). Unique clusters are indicated by green color on top row. P values were calculated by two-sided Mann–Whitney U test. E Forest plots of response odds ratios (ORs) and confidence interval (CIs) for MCP-counter. All OR and CI values for response were extracted from logistic regression models. F Relevance of MCP-counter scores for T cells, cytotoxic lymphocytes and myeloid dendritic cells with regard to B lineage (n = 12 Rs and 5 NRs) as indicated. Correlation coefficients were calculated by Spearman correlation analyses. Each dot represented one sample. G Multiplex immunofluorescence assay of TLSs for the following markers: CD19, CD4, CD8, and DAPI. Original magnification, ×20. Scale bar is 1 mm or 100 µm. H Representative image of CD19 and CD3 staining of TLSs in a responder after treatment with camrelizumab combined with apatinib. Scale bar is 1 mm. I. Quantification of CD19, CD4, CD8 (cohort 1, n = 20 Rs and 9 NRs) and TLSs (cohort 1 nonlymph node tissues, n = 13 Rs and 8 NRs) density by multiplex immunofluorescence assay and association with response to camrelizumab combined with apatinib in patients with first-line platinum-resistant. All data in box and whiskers plots (3I) are represented as median value, quartile, maximum and minimum; each dot represented one sample. P values were calculated by two-tailed, Mann–Whitney U test. Source data are provided as a Source Data file.

