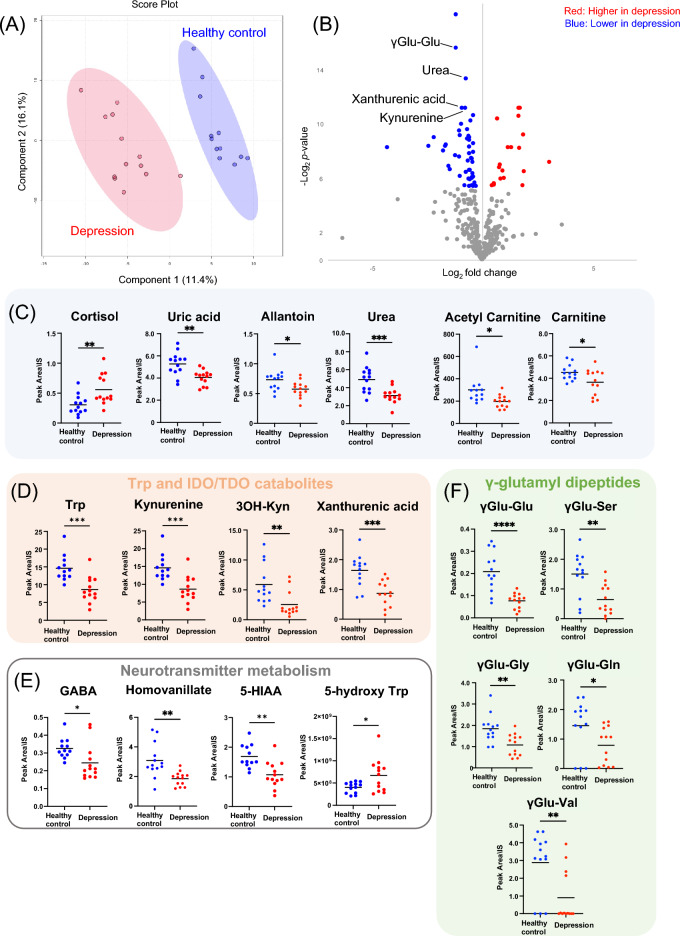
Figure 1.
Plasma metabolite levels of MDD and HCs at baseline. PLS-DA score plot showing that patients with MDD and HCs formed different clusters (A). PLS-DA cross-validation details and variable importance in projection (VIP) scores for Fig. 1A were shown in Fig. S1 and Table S1, respectively. In addition, VIP scores for Fig. 1A were shown in Table S2. Volcano plot comparing the levels of metabolites in patients with MDD and HCs at the baseline. The blue and red dots represent significantly (p < 0.05) downregulated and upregulated metabolites in patients with MDD (B). Metabolites showed statistical differences in levels between patients with MDD and HCs at the baseline (C–F). Abbreviations: GABA, gamma-aminobutyric acid; HC, healthy control; IDO, indoleamine 2,3-dioxygenase; MDD, major depressive disorder; PLS-DA, partial least-squares discriminant analysis; TDO, tryptophan 2,3-dyoxygenase; Trp, tryptophan; γGlu-Glu, gamma glutamyl-glutamic acid; γGlu-Ser, gamma glutamylserine; γGlu-Gly, gamma glutamylglycine; γGlu-Gln, gamma glutamylglutamine; γGlu-Val, gamma glutamylvaline; 3OH Kyn, 3-hydrokynurenine; 5-HIAA, 5-hydroxyindoleacetic acid. *p < 0.05, **p < 0.01, ***p < 0.001.

