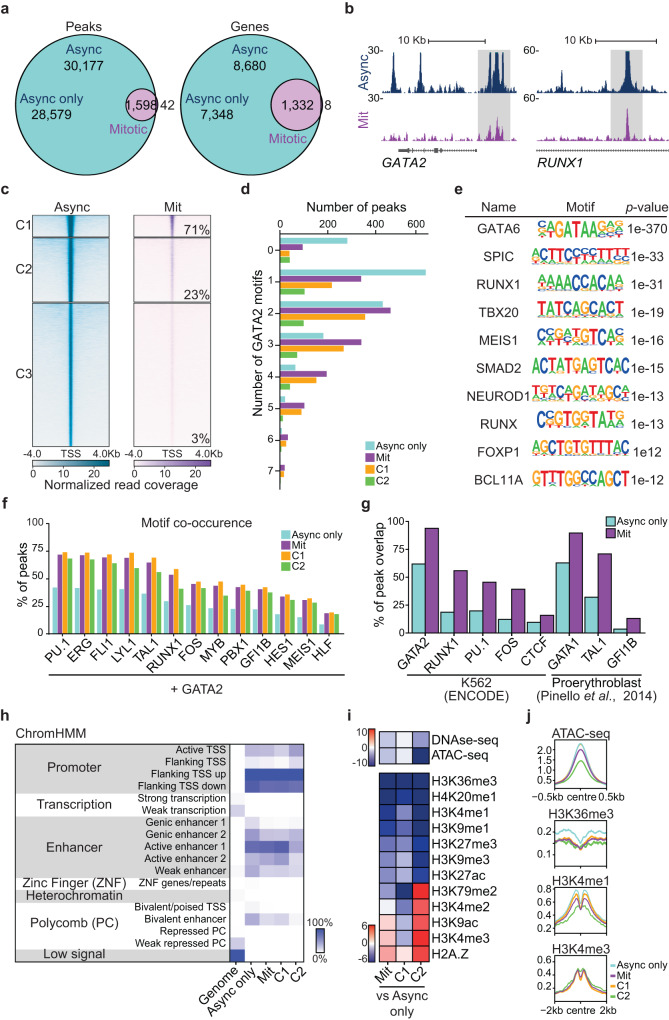
Fig. 3. GATA2 bookmarks a subset of interphasic target genes with roles in definitive haematopoiesis.
a Venn diagram showing the number of ChIP-seq GATA2 peaks and genes shared between asynchronous (Async) and mitotic K562 cells. Async only refers to non-bookmarked peaks and genes in asynchronous cells. b Gene tracks for GATA2 binding sites at GATA2 and RUNX1 loci showing both mitotic (Mit) bookmarked (grey) and asynchronous unique peaks. Kb – kilobase. c K-means clustering of Async (left) and Mit peaks (right). The percentage of mitotic (bookmarked) peaks overlapping with asynchronous peaks in each cluster is shown. The 42 mitotic-unique peaks are not shown. d Number of GATA2 motifs in Async only peaks, mitotic peaks and mitotic clusters 1 (C1) and 2 (C2). e De novo motif enrichment analysis for GATA2 mitotic bookmarked target sites. Top ten motifs are shown with respective p-values. f Percentage of GATA2 peaks where motifs for relevant HSPCs regulators are also present. g Percentage of overlap between GATA2 peaks and peaks for HSPC regulators from available ChIP-seq datasets. h Chromatin-state enrichment heatmap representing the percentage of genome occupancy of GATA2 per group of peaks. Scale represents the percentage of peaks at each genomic segment. TSS – Transcription start site. i Integration heatmap with histones marks, DNAse-seq and ATAC-seq data for K562 cells (ENCODE). Scale represents the accumulated sum differences across bins between Async only and mitotic peaks and clusters. j Histone marks and ATAC-seq profiles at peak summit (centre). Source data are provided as Source Data file.

