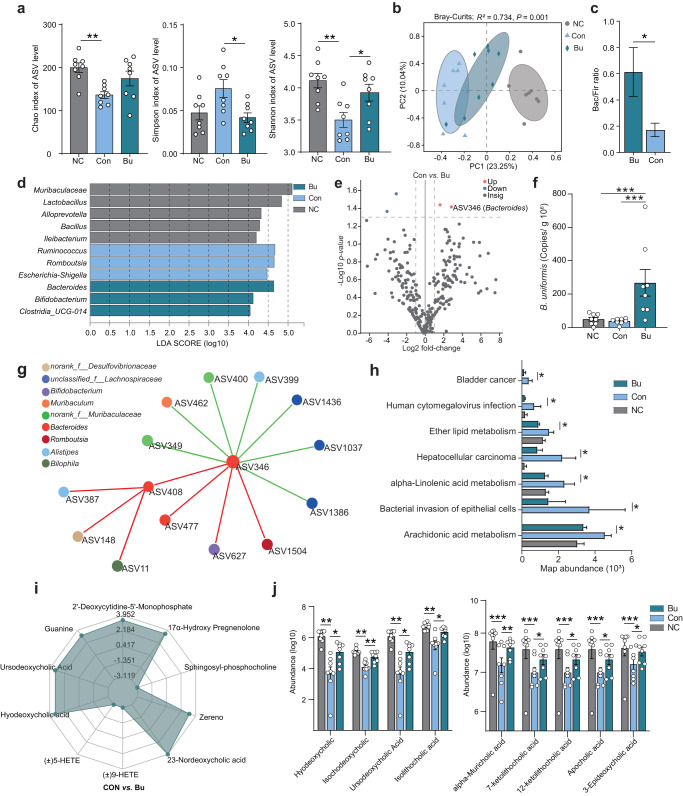
Fig. 2. B. uniformis JCM5828 reshapes the intestinal microbiota and regulates intestinal bile acid metabolism.
Samples of colonic content from mice that were euthanized after treatment or died naturally during treatment were collected for 16 S rRNA and metagenomic sequencing. a The α diversity based on Chao, Simpson, and Shannon indexes (female, n = 8 per group). Data were analyzed using Kruskal–Wallis with Tukey–Kramer’s test. b Principle coordinate analysis (PCoA) plot based on the ASV matrix in three groups. β-diversity was determined using Adonis with Bray–Curtis test. c The Bacteroides to Firmicutes (Bac/Fir) ratio in three groups. Data were analyzed using one-way ANOVA with Tukey’s test. d Bacterial taxa identified as differentially abundant between groups according to LEfSe. The bacterial taxa of the three groups were compared at the genus level. Data were analyzed using the one-against-all multi-group comparison strategy, with an LDA threshold set at >4.0. e Differentially enriched bacteria between Bu and Con groups. Blue dots represent bacteria with higher abundance in the samples of Bu group. Gray dots represent bacteria with no significant difference between the two groups. P values were adjusted by Benjamini–Hochberg (BH) method to control FDR. FDR-adjusted P < 0.05 was shown. f Copy number of Bu in mouse colonic contents. Data were analyzed using one-way ANOVA with Tukey’s test. g Colonic microbial co-occurrence network analysis based on core ASV. Spearman’s rank correlation coefficient >0.60; P value <0.05. Different colors represent different genera in the colon. The size of nodes is proportional to the relative abundance of the ASV. The red and green lines indicate positive and negative correlations between species, respectively. h The potential functional pathways of colonic content microbiota based on PICRUSt2. Data differences were assessed using Kruskal–Wallis with Tukey–Kramer’s test. i Radar plot of differential metabolites in Con vs. Bu groups. Grid lines represent log2 values of difference multiples. j The relative abundance of nine differential metabolites in three groups. Differential metabolites were defined as metabolites with a fold change ≥2 and ≤0.5. Data were analyzed using Kruskal–Wallis with Tukey–Kramer’s test. *p < 0.05, **p < 0.01, ***p < 0.001. Data were expressed as the means ± SEM.

