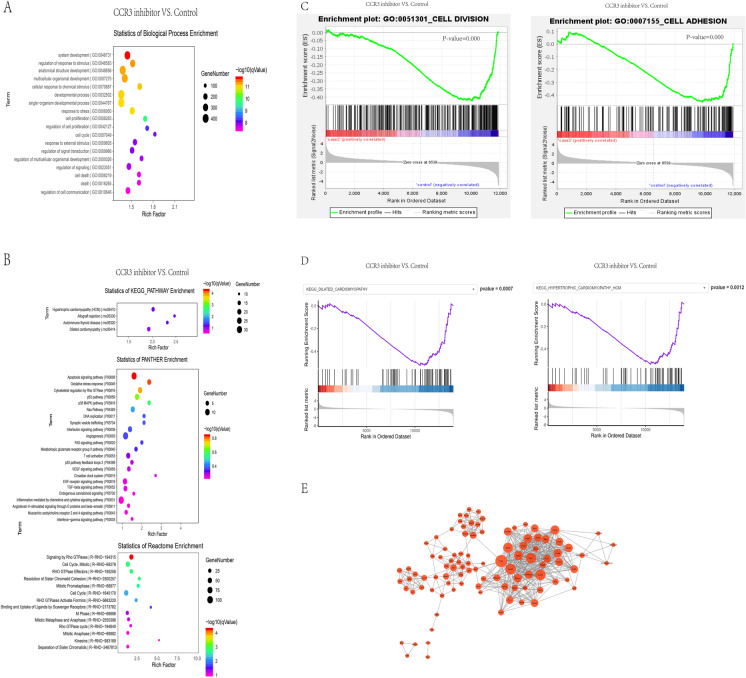
Fig. 11.
Bioinformatics analysis of differentially expressed genes. A The top 30 enrichment of the biological process results are listed. B The enriched signaling pathways from KEGG pathway, panther enrichment, reactome enrichment analysis. C Gene set enrichment analysis (GSEA)–GO function enrichment plots of representative gene sets from CCR3 inhibitor group and Control group: negative regulation of cell division, negative regulation of cell adhesion. D Gene set enrichment analysis (GSEA)–pathway enrichment plots of representative gene sets from CCR3 inhibitor group and control group: negative regulation of dilated cardiac cardiomyopathy (DCM) pathway, negative regulation of hypertrophic cardiomyopathy (HCM) pathway. E The PPI analysis of the differentially expressed genes

