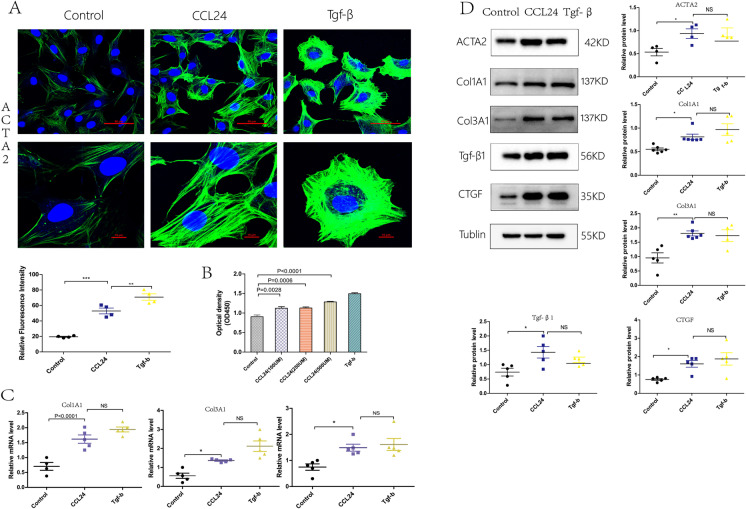
Fig. 8.
CCL24 promoted primary cardiac fibroblast activation. A Immunofluorescence of ACTA2 in heart tissues in mice. Scale bar in panel A upper part is 50 μm; scale bar in panel A lower part is 10 μm. B CCK8 counting assay of the proliferation of cardiac primary fibroblast. The data are represented as the means ± SEM (one-way ANOVA; P = 0.0028: control group vs. CCL24 100UM group, P = 0.0006: control group vs. CCL24 250UM group, P < 0.0001: control group vs. CCL24 500UM group). C Quantitative real-time polymerase chain reaction analysis of the mRNA levels of ACTA2, COL1A1 and COL3A1 in cardiac primary fibroblast with different stimulations. The data are represented as the means ± SEM (unpaired Student’s t test; P < 0.05: control group vs. CCL24 group). D Western blot analysis of ACTA2, COL1A1, COL3A1, Tgf-β, and CCN2 protein in in cardiac primary fibroblast under different stimulation. The data are represented as the means ± SEM (unpaired Student’s t test; P < 0.05: control group vs. CCL24 group)

