Fig. 1.
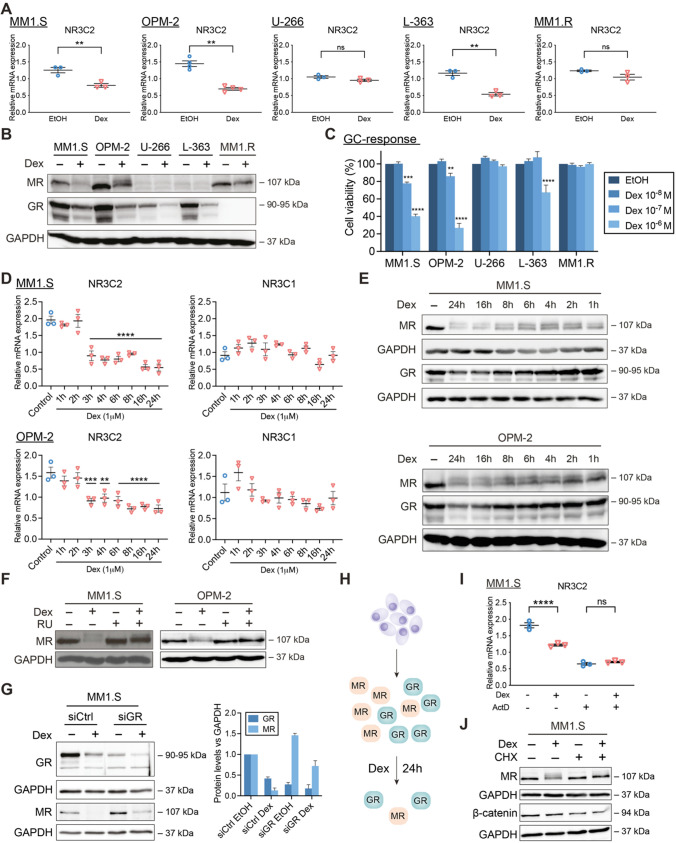
GCs downregulate MR mRNA and protein levels in a GR-dependent way. (A, B) MM1.S, OPM-2, U-266, L-363 and MM1.R cells were treated with Dex (10−6 M) or solvent control (EtOH), (A) for 6 h, followed by RT-qPCR (all N = 3, except OPM-2: N = 4), assessing the mRNA levels of NR3C2 (MR), or (B) for 24 h, followed by WB analysis (N = 3). The protein levels of MR (107 kDa) and GR (90–95 kDa) were determined, with GAPDH (37 kDa) as loading control. (C) MM1.S, OPM-2, U-266, L-363 and MM1.R cells were treated for 72 h with a Dex concentration range (10−6 M–10−8 M) or solvent control (EtOH, set as 100%), followed by a CelltiterGlo cell viability assay (72 h Dex range recapitulated from Figs. 2I and 3B–D). The bar plots represent the mean ± SEM. Statistical analyses were performed using GraphPad Prism 9, using a two-way ANOVA with post hoc testing. Per cell line, 10−6 M Dex and 10−7 M Dex conditions were statistically compared to the 10−8 M Dex condition. (D, E) MM1.S or OPM-2 cells were treated for different time points with Dex (10−6 M) or solvent control (EtOH) followed by (D) RT-qPCR (N = 3), assessing the mRNA levels of NR3C2 (MR) and NR3C1 (GR) and in which statistical analyses compared each time point to solvent control, or (E) WB analysis (N = 3), in which the protein levels of MR (107 kDa) and GR (90–95 kDa) were determined, with GAPDH (37 kDa) as loading control. (F) OPM-2 and MM1.S cells were treated with Dex (10−6 M), RU (10−5 M), a combination thereof or solvent control for 24 h, followed by WB analysis (N = 3). The protein levels of MR (107 kDa) were determined, with GAPDH (37 kDa) as loading control. (G) MM1.S cells were nucleofected with siCtrl (scrambled) or siGR and 48 h post-nucleofection treated for another 24 h with Dex (10−6 M) or solvent control, followed by WB analysis (N = 3) and band densitometric analysis (bar plot). The latter shows the normalized GR or MR protein levels (vs. GAPDH), averaged over 3 biological replicates. (H) Graphical summary. In MM cells containing GR and MR protein, Dex downregulates GR protein levels and to an even higher extent MR protein levels, especially at 24 h. (I) MM1.S cells were treated for 3 h with Dex (10−6 M), ActD (1 μg/mL), a combination thereof or solvent, followed by RT-qPCR (N = 3), assessing the mRNA levels of NR3C2. (J) MM1.S cells were treated for 6 h with Dex (10−6 M), CHX (20 μg/mL), a Dex/CHX combination or solvent control, followed by WB analysis (N = 3) and band densitometric analysis. The protein levels of MR (107 kDa), or β-catenin (94 kDa; positive control for inhibition of protein translation) were determined, with GAPDH (37 kDa) as loading control. Data information: (A, D, I) RT-qPCRs were analyzed using qBaseplus with SDHA, RPL13A and YWHAZ serving as reference genes. Note that the mRNA levels of the targets of interest are normalized to those of the above-mentioned reference genes (relative mRNA expression in the y-axis). The scatter plots represent the mean (solid line) ± SEM. Statistical analyses were performed using GraphPad Prism 9, using a one-way ANOVA with post-hoc testing. (B, E, F, G, J) One representative image is shown for each WB experiment, with the number of biological replicates mentioned in each panel description

