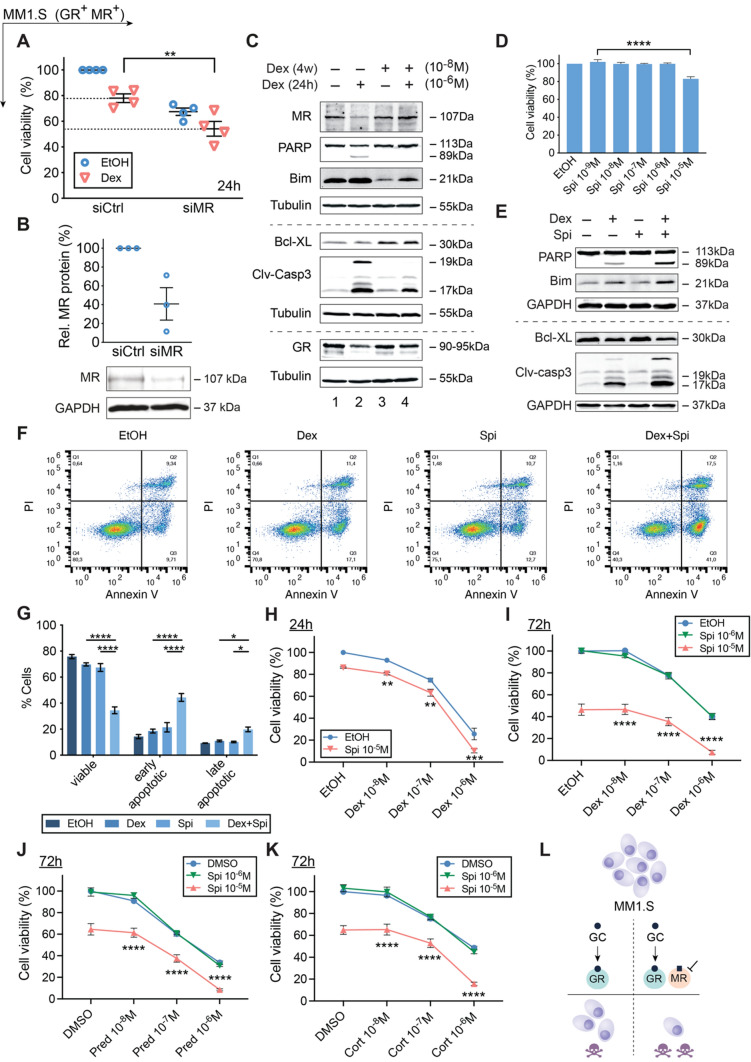
Fig. 2.
GC-induced MM1.S cell killing is promoted by the MR antagonist Spi. (A) MM1.S cells were nucleofected with siCtrl (scrambled) or siMR. 48 h post-nucleofection, cells were reseeded and treated for another 24 h with Dex (10−6 M) or solvent control (EtOH), followed by a CelltiterGlo assay. The scatter plot represents the mean (solid line) ± SEM (N = 4). The siCtrl solvent condition was set as 100% and the other conditions were recalculated accordingly. (B) 72 h post-nucleofection with siCtrl or siMR, WB analyses were performed and MR protein levels relative to GAPDH were quantified by band densitometric analysis using ImageJ. The scatter plot represents the mean ± SEM (N = 3). (C) MM1.S cells were treated for 4 weeks with 10−8 M Dex (or EtOH), followed by 24 h 10−6 M Dex (or EtOH), and subjected to WB analyses (N = 3). (D) MM1.S cells were treated with a Spi concentration range (10−5 M–10−9 M) or solvent control (set as 100%), followed by a CelltiterGlo assay (N = 3). (E–G) MM1.S cells were treated with Dex (10−6 M), Spi (10−5 M) or a Dex-Spi combination for 24 h, followed by (E) WB analyses (N = 4) or (F, G) Annexin V/PI flow cytometric analyses (N = 4). (F) Representative quadrant plots of 4 independent experiments for each treatment condition, with (G) bar plots showing the percentage of viable (Q4), early apoptotic (Q3), late apoptotic (Q2) averaged over all 4 biological repetitions ± SEM. (H, I) MM1.S cells were treated with Dex (10−6 M–10−8 M), Spi (10–5–10−6 M) or a Dex-Spi combination for (H) 24 h (N = 5) or (I) 72 h (N = 3), followed by a CelltiterGlo assay (solvent control set as 100%). (J, K) MM1.S cells were treated with Pred or Cort (10−6 M–10−8 M), Spi (10–5–10−6 M) or a Pred/Spi or Cort/Spi combination for 72 h (N = 3), followed by a CelltiterGlo assay (solvent control set as 100%). (L) Summarizing model demonstrating that MR blockade increases Dex-induced MM1.S cell killing. Data information: (A, D, G–K) Statistical analyses were performed using GraphPad Prism 9, using (A, D) one-way or (G–K) two-way ANOVA with post hoc testing. (C, E) Protein lysates were subjected to WB analyses, visualizing the protein levels of MR (107 kDa), GR (90-95 kDa), PARP (89 and 113 kDa), Bim (21 kDa), Bcl-XL (30 kDa) and cleaved-caspase 3 (17 and 19 kDa). Tubulin (55 kDa) or GAPDH (37 kDa) served as loading controls. One representative image is shown for each WB experiment, with the number of biological replicates mentioned in each panel description

