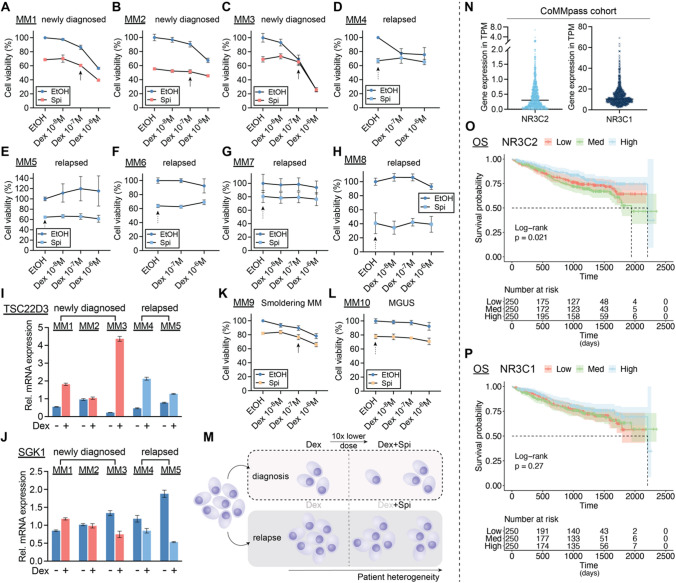
Fig. 4.
Combining lower doses of Dex with the MR antagonist Spi enhances cell killing in primary myeloma cells depending on the disease stage. (A–H) Patient-derived MM cells from bone marrow aspirates of (A–C) newly diagnosed, (D–H) relapsed or MM patients were treated with a Dex concentration range (10−6 M–10−8 M), Spi (10−5 M), a Dex-Spi combination or solvent control (EtOH) for 24 h (A, C–G) or 72 h (B, H), followed by a CelltiterGlo cell viability assay. (I, J) When the primary cell yield was sufficient, primary MM cells were treated for 6 h with Dex (10−6 M) or solvent control, followed by RNA isolation and RT-qPCR analyses to determine the expression levels of TSCD22D3 (GILZ) and SGK1. Data analyses were performed using qBaseplus with SDHA, RPL13A and YWHAZ serving as reference genes. Note that the mRNA levels of the targets of interest are normalized to those of the above-mentioned reference genes (relative mRNA expression in the y-axis). The bar plots represent the mean ± SD of 3 technical replicates. Overall, no statistical analyses were performed because only 1 biological replicate could be carried out given the limited culturing time of primary MM cells isolated from a BM aspirate. (K, L) Patient-derived MM cells from bone marrow aspirates of premalignant (smoldering MM or MGUS) myeloma patients were treated with a Dex concentration range (10−6 M–10−8 M), Spi (10−5 M), a Dex-Spi combination or solvent control (EtOH) for 24 h (L) or 48 h (K) followed by a CelltiterGlo cell viability assay. (M) Graphical summary demonstrating that primary MM cells isolated at diagnosis undergo profound Dex-mediated cell killing, while the addition of Spi to a tenfold lower Dex dose triggers more extensive cell killing, although not the same extent in all patients. In the relapsed setting, Dex is unable to induce significant primary MM cell killing, while Spi triggers a substantial MM cell killing response. The extent of the described cell killing effects varies from patient to patient, due to interpatient heterogeneity, which is well known in MM. (N) TPM (transcripts per million) gene expression values, generated via RNA-sequencing, of NR3C2 (MR) and NR3C1 (GR) in the CoMMpass cohort; only samples at diagnosis were taken along. (O, P) Kaplan–Meier curve of the MMRF patient cohort, depicting the survival probability in function of overall survival (OS) for low, medium or high expression of (O) NR3C2 or (P) NR3C1. Statistical analyses were performed in R (package survival), using a log-rank test. Data information: (A–H, K, L) Each data point represents the mean ± SD of technical replicates because only one biological repetition could be performed with the primary myeloma cells. The solvent condition was set as 100% and the other conditions were recalculated accordingly. Full arrows highlight the effect of the combination of a tenfold lower Dex dose with Spi, while dashed arrows indicate the effect of Spi alone

