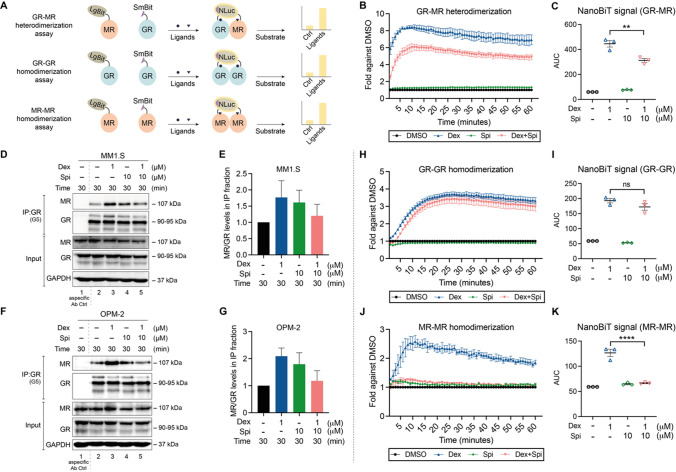
Fig. 5.
Crosstalk between GR and MR may result from an endogenous interaction that can be modulated with ligands. (A) Principle of the NanoBiT-based dimerization assays. In the GR–MR heterodimerization assay, the Large BiT (LgBiT) and Small BiT (SmBiT) fragments of the NanoLuc® luciferase, which have very low affinity for each other, are coupled to MR (at the N-terminus) or GR (at the C-terminus), respectively, and transfected into HEK293T cells. When the addition of ligand promotes GR–MR heterodimerization, the LgBiT and SmBiT come in close proximity of each other, hereby reconstituting the functional NanoLuc® luciferase. Following substrate addition (furimazine, cell-permeable substrate), the bioluminescent signal can be measured in intact cells. This NanoBiT-based assay was expanded to also measure GR–GR and MR–MR homodimerization. In both cases, LgBiT was coupled to the N-terminus and SmBiT to the C-terminus of both respective receptors. (B, C) HEK293T cells were transfected with LgBiT-MR and GR-SmBiT. 24 h post-transfection, substrate is added and the baseline luminescence is recorded. Thereafter, cells are treated with Dex (10−6 M), Spi (10−5 M), the combination thereof, or solvent control and luminescence is measured continuous during 60 min (1-min intervals) (N = 3). (C) Statistical comparison of the area under the curve of Dex vs Dex-Spi NanoBiT results in panel B (N = 3). (D–G) Two myeloma cell lines, i.e. (D) MM1.S and (F) OPM-2 cells were treated with Dex (10−6 M), Spi (10−5 M), a Dex-Spi combination or solvent control for 30 min. Protein lysates were prepared and subjected to endogenous immunoprecipitation using GR (G5) antibody (both cell lines N = 2). Thereafter, WB analyses were performed to determine co-immunoprecipitation of GR (90–95 kDa) with MR (107 kDa). GAPDH served as loading control for the input fraction. Lane 1 represents the non-specific antibody control. (E, G) In the IP fraction, MR protein levels were quantified relative to GR protein levels by band densitometric analysis using ImageJ. The bar plot displays the ratio of MR/GR in the IP fraction averaged over both biological repetitions (+ / SEM). (H–K) HEK293T cells were transfected with (H) LgBiT-GR and GR-SmBiT, or (J) LgBiT-MR and MR-SmBiT. 24 h post-transfection, substrate is added and the baseline luminescence is recorded. Thereafter, cells are treated with Dex (10−6 M), Spi (10−5 M), the combination thereof, or solvent control and luminescence is measured continuous during 60 min (1-min intervals) (N = 3). (I, K) Statistical comparison of the area under the curve of Dex vs Dex-Spi NanoBiT results in panel H and J (N = 3). Data information: (D, F) One representative image is shown for each co-IP experiment; the other biological replicates are available for consultation in Supplementary Fig. 5

