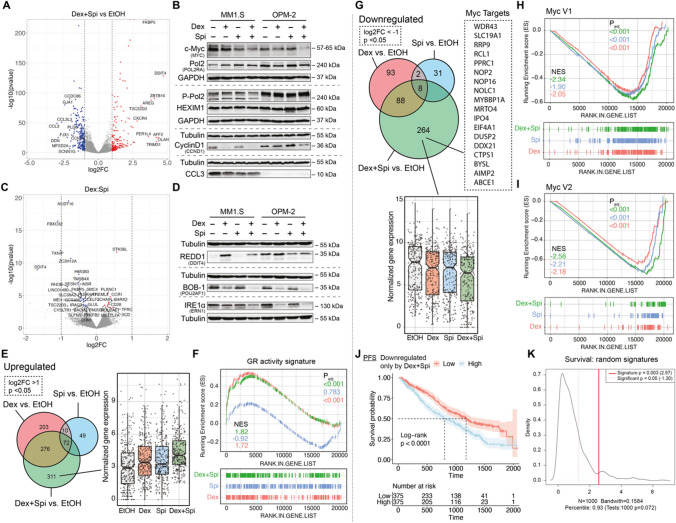
Fig. 6.
c-myc and its target genes are inhibited most by Dex-Spi treatment, while a subset of Dex-Spi downregulated genes may predict prognosis. (A, C) MM1.S cells were treated with Dex (10−6 M), Spi (10−5 M), a Dex-Spi combination or solvent control (EtOH) for 6 h, followed by RNA-seq analysis. (A, C) Volcano plots depicting the padj (log10 scale) in function of the log2FC for all genes with baseMean ≥ 50 for (A) the pairwise comparison Dex-Spi vs EtOH or (C) the interaction term genes (= those for which the response following Dex-Spi treatment is significantly different from combining the separate responses of Dex and Spi). Significantly regulated genes (padj < 0.05) are colored in red (log2FC > 1 in A, log2FC > 0 for C, upregulated) or blue (log2FC < -1 in A, log2FC < 0 for C, downregulated); non-significant genes (padj > 0.05) in grey. The gene names are displayed for those genes having the largest abs(log2FC) values (top 10 upregulated/downregulated). The dashed lines are set at abs(log2FC) = 1. (B, D) MM1.S and OPM-2 cells were treated with Dex (10−6 M), Spi (10−5 M), a Dex-Spi combination or solvent control (EtOH) for 24 h (both N = 3). Protein lysates were prepared and subjected to WB analyses, hereby assessing the protein levels of (P-Ser2) Pol2 (240 kDa), GR (90–95 kDa), c-myc (57–65 kDa), cyclin D1 (36 kDa), MIP-1α (CCL3, 10 kDa), DDIT4 (35 kDa), IRE1α (110–130 kDa) and BOB-1 (35 kDa). GAPDH (37 kDa) and Tubulin (55 kDa) served as loading controls. (E, G) Venn diagram of three pairwise comparisons, split up in genes that were either (E) upregulated or (G) downregulated. In addition, the normalized gene expression profiles of the genes that are uniquely regulated by Dex-Spi are shown. (F, H, I) Gene set enrichment analysis (GSEA) of single hallmarks, i.e. (F) a GR activity signature and (H, I) two sets of cyc target genes (V1, V2), for each pairwise comparison, along with the respective normalized enrichment score (NES) and padj. (J) Kaplan–Meier curve of the MMRF patient cohort (N = 750), depicting the survival probability in function of progression-free survival (PFS) for low or high expression of genes that were uniquely downregulated by the Dex-Spi combination. Statistical analyses were performed in R (package survival), using a log-rank test. (K) Prognostic factor analysis of the genes uniquely downregulated Dex-Spi (red solid curve) versus random signatures (red dotted curve). Prognostic power as determined by SigCheck (R package) of the genes uniquely downregulated by Dex-Spi (red dotted line) with 1000 random gene-sets of the same size (P value < 0.05 is indicated by the red dotted line) for the PFS parameter in the CoMMpass cohort. Data information: (B, D) One representative image is shown for each WB experiment, with the number of biological replicates mentioned in each panel description

