Fig. 1.
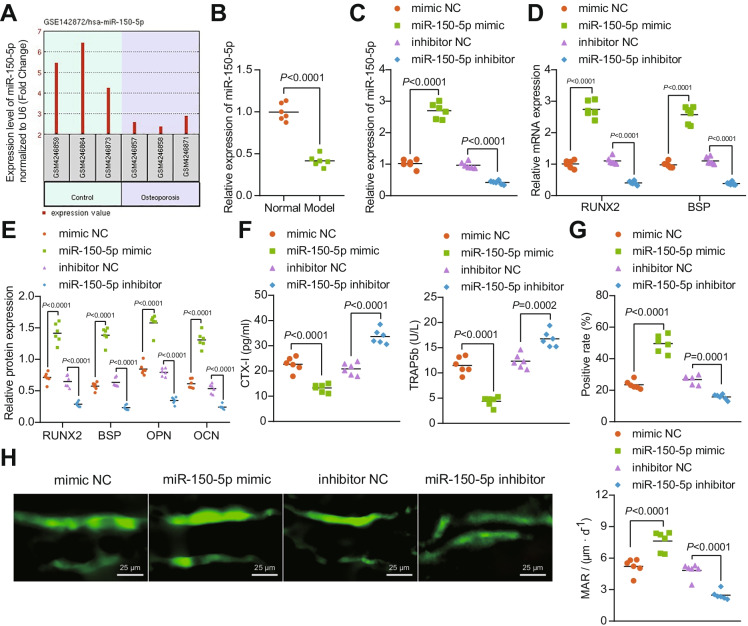
The promoting effect of miR-150-5p on the osteogenesis in DO rats. A Differential expression of miR-150-5p in the GSE142872 dataset (3 serum samples from osteoporosis patients and 3 serum samples from healthy individuals) from GEO database (https://www.ncbi.nlm.nih.gov/gds). Differential analysis was conducted using R language “limma” package with p < 0.05 as the threshold to identify differentially expressed genes. B miR-150-5p expression determined by RT-qPCR in the bone tissues of normal and DO rats. C miR-150-5p expression determined by RT-qPCR in the bone tissues of miR-150-5p mimic or miR-150-5p inhibitor-treated DO rats. D mRNA expression of RUNX2 and BSP determined by RT-qPCR in the bone tissues of miR-150-5p mimic or miR-150-5p inhibitor-treated DO rats. E Immunoblotting of RUNX2, BSP, OPN, and OCN proteins in the bone tissues of miR-150-5p mimic or miR-150-5p inhibitor-treated DO rats. F Serum levels of CTX-I and TRAP5b in miR-150-5p mimic or miR-150-5p inhibitor-treated DO rats determined by ELISA. G Immunohistochemistry analysis of the rate of positive osteoblasts in miR-150-5p mimic or miR-150-5p inhibitor-treated DO rats. H Immunofluorescence staining analysis (calcein double labeling) for the bone mineralization rate on the trabecular bone surface in miR-150-5p mimic or miR-150-5p inhibitor-treated DO rats. * p < 0.05. n = 6

