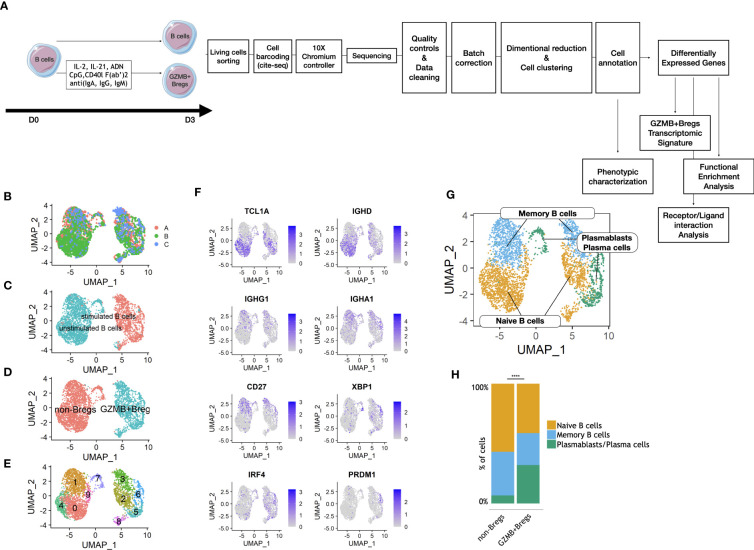
Figure 1.
Clustering and phenotyping of GZMB+Bregs. Schematic view of the study design from the cell preparation for scRNAseq. GZMB+Bregs or non-Bregs were induced from B cells isolated from PBMC. Living cells were then marked with anti-β2-microglobulin or anti-CD293 conjugated DNA sequences specific of the donor and the experimental condition following CITE-seq protocols. Libraries were then prepared and sequenced on a Nova-Seq 6000 (Illumina) in 3 different runs: 1,989 cells in run 1, 3,919 cells in run 2 and 1,493 cells in run 3. Data were corrected for batch effect and analyzed on R using the Seurat library. After dimensional reduction and cell clustering, cells were annotated based on their expression of phenotypic markers to characterize B cell subpopulations in GZMB+Bregs as compared to non-Bregs. Th differentially expressed genes were calculated on the 5901 genes expressed at least in 20% of cells in one of the two compared groups. Only genes with a Log2(Fold-change) > 0.58 (corresponding to the Fond-Change of GZMB) and an adjusted p.value <0.05 were selected for the transcriptomic signature of GZMB+Bregs and functional enrichment analysis (A). Batch effect was corrected by combining cells from the 3 different runs with reciprocal PCA. Transcriptomes of Bregs and non-Bregs cells were analyzed using an unsupervised dimensionality reduction algorithm (UMAP) to identify groups of cells with similar gene expression profiles. Each point represents a cell and is represented in color by its Batch (B). (C–E) Transcriptomes of Bregs and non-Bregs cells from 4 HVs were analyzed using an unsupervised dimensionality reduction algorithm (Seurat) to identify groups of cells with similar gene expression profiles. Each point represents a cell and is represented in color by its stimulated or unstimulated status as characterized by HTO (C), unsupervised (D) or supervised (E) clustering. (F) Expression of markers used for phenotypic classification of naive and immature B cells (TCL1A, IGHD), memory B cells (IGHG1, IGHA1, CD27), and plasmablasts/plasma cells (XBP1, IRF4, PRDM1, CD27). (G) Phenotype of the naive, memory, and plasmablasts/plasma subset of B cells as represented in UMAP. (H) Percentage of naive, memory, and plasmablasts/plasma cells in non-Bregs and GZMB+Bregs metaclusters were analyzed using Khi2-test. The plasmablasts were significantly enriched in GZMB+Bregs (p<0.0001). Differences were defined as statistically significant with p<0.0001 (****).

