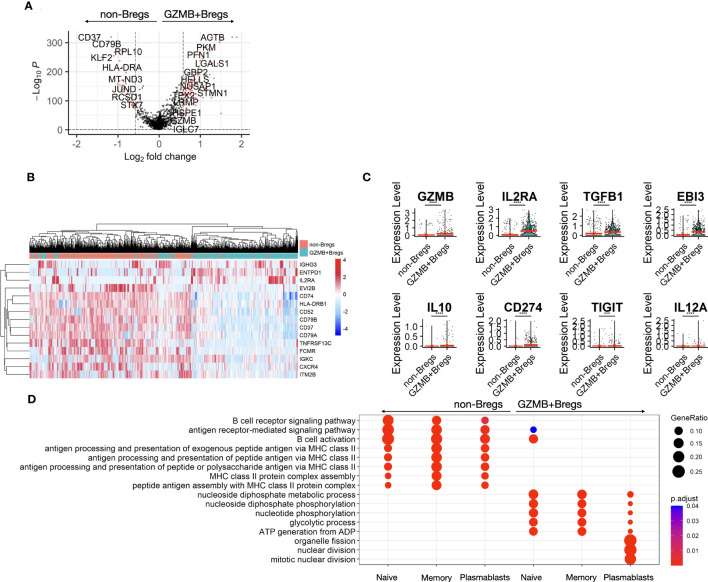
Figure 2.
B cell differential expression. The two clusters of GZMB+Bregs and non-Bregs were analyzed using differential expression methods (Seurat, MAST) to identify DEGs represented in volcano plot. Each point represents a gene by its fold change difference between the two clusters and the adjusted p.value (A). Among the genes with a fold change greater than GZMB, the 15 associated to cell-surface proteins were represented as a heatmap (B). Different Bregs subsets have been characterized by several markers with variable expression in this dataset (C). Gene ontology analysis was performed on the 104 up- and 45 down-regulated DEGs. Redundent terms were then reduced using the rrvgo package (1.8.0). (D) Differential gene expression and their ontologies were also analyzed within the naive, memory and plasmablasts/plasma cells and represented in dotplots. Differences were defined as statistically significant when P<0.001 (***) and P<0.0001 (****).

