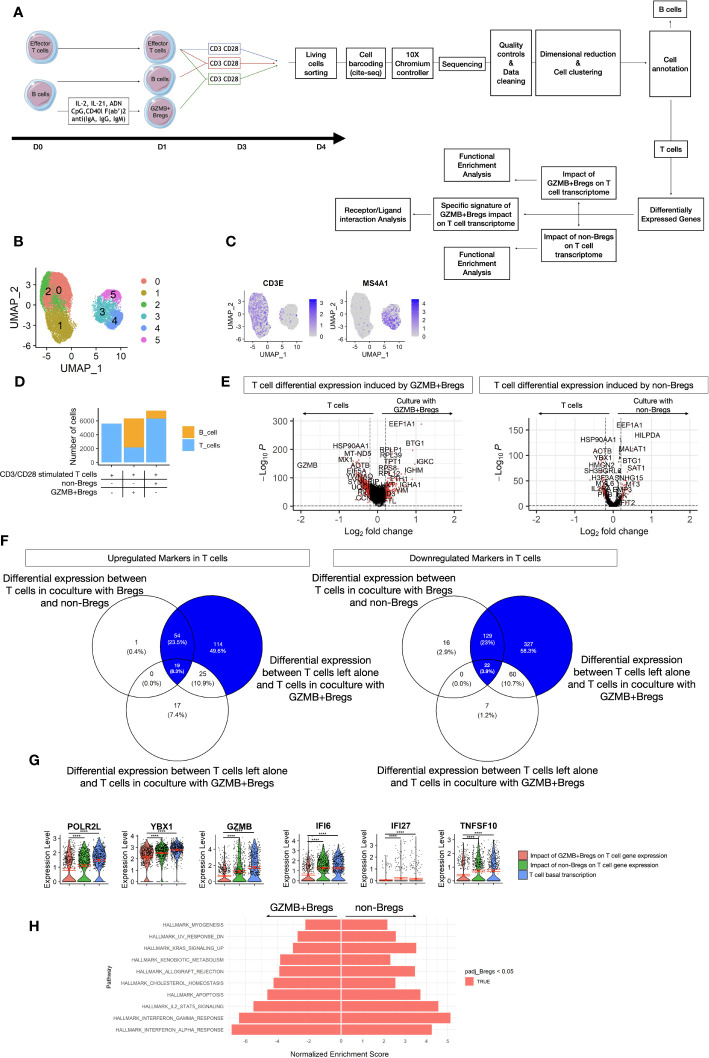
Figure 3.
T cells coculture dataset. (A) Schematic view of the study design from the cell preparation for scRNAseq. GZMB+Bregs or non-Bregs were induced from B cells isolated from PBMC for 1 day. CD3/CD28 activated T cells were cultivated alone, with non-Bregs or GZMB+Bregs for 3 days. At the end of the cultures, living cells were marked with anti-β2-microglobulin or anti-CD293 conjugated DNA sequences specific of the donor and the experimental condition following CITE-seq protocols. Libraries were then prepared and sequenced on a Nova-Seq 6000 (Illumina). After dimensional reduction and cell clustering, cells were annotated based on their expression of phenotypic markers to characterize B cell and T cells. After 3 days of culture in absence of Bregs induction cocktail, the expression of GZMB was not differential between GZMB+Bregs and non-Bregs. Thus, the B cells were not analyzed. Differentially expressed genes were calculated on the 5901 genes expressed at least in 20% of cells in one of the two compared groups. Only genes with a Log2(Fold-change) > 0.2 and an adjusted p.value <0.05 were selected for the transcriptomic signature of GZMB+Bregs and functional enrichment analysis. The signature of GZMB+Bregs impact on T cell transcriptome was described as the differentially expressed genes between T cells in culture with or without GZMB+Bregs and not differentially expressed in culture with or without non-Bregs, unless the genes were also differentially expressed in T cells in culture with GZMB+Bregs or non-Bregs. (B–H) Transcriptomes of Bregs and non-Bregs cells from 2 HVs were analyzed using an unsupervised dimensionality reduction algorithm (Seurat) to identify groups of cells with similar gene expression profiles. Each point represents a cell and is represented in color by its unsupervised clustering (B) and Expression of phenotypic markers CD3E and CD20 (C). The proportions of B and T cells within each condition was represented as a Histogram of the number of B cells and T cells within each condition (D). The imprints of GZMB+Bregs and non-Bregs on T cell transcriptome were analyzed using differential expression methods (Seurat, MAST) to identify DEGs represented in volcano plot. Each point represents a gene by its fold change difference between the two clusters and the adjusted p.value (E). The specific imprint of GZMB+Bregs was determined using Venn diagram to exclude the 85 genes also modulated by non-Bregs with no exacerbated expression between the two conditions of T cells in culture with GZMB+Bregs or non-Bregs (F). The 6 most downregulated genes are represented in violin plots (G). Differences were defined as statistically significant when P<0.0001 (****). (H) GZMB+Bregs and non-Bregs induce opposite effect on effector-T cell related pathways and non-immune related cell-activation pathways from the Hallmark library as represented by their Normalized Enrichment Score from GSEA.

