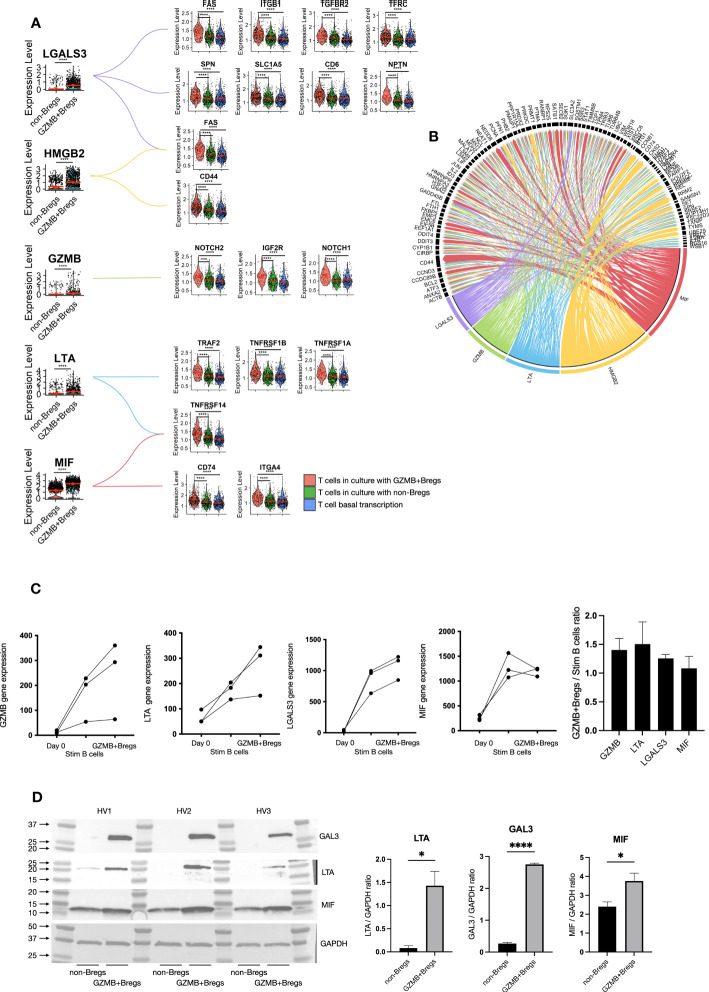
Figure 4.
GZMB+Bregs interactions with T cells. To understand regulatory B cells mechanisms, we used the nichenet algorithm that predict the interaction of B cell ligands with receptors on the T cell based on T cell DEGs and prior knowledge on the transcriptomic changes downstream receptor-ligand interaction. Among the 149 DEGs in GZMB+Bregs compared to non-Bregs, LGALS3, GZMB, LTA, HMGB2 and MIF were predicted to be potent inducers of T cell differential expression. (A) B cell expression of predicted ligands and their receptors are represented in violin plots. (B) Predicted ligand induced gene transcription is represented as a chord diagram. Arrow widths represents the strenght of the interactions. (C, D) LTA, LGALS3 and MIF gene expression were validated using the nCounter® SPRINT Profiler in GZMB+Bregs compared to activated B cells and B cells before the stimulation with the GZMB as a control (C) and at the protein level by western blot (D). RNA and protein analysis were independently performed on B cells from 3 HVs. Data represent each independent experiment. Data represent mean ± SEM. Differences were defined as statistically significant by t.test when P<0.05 (*) and P<0.0001 (****).

