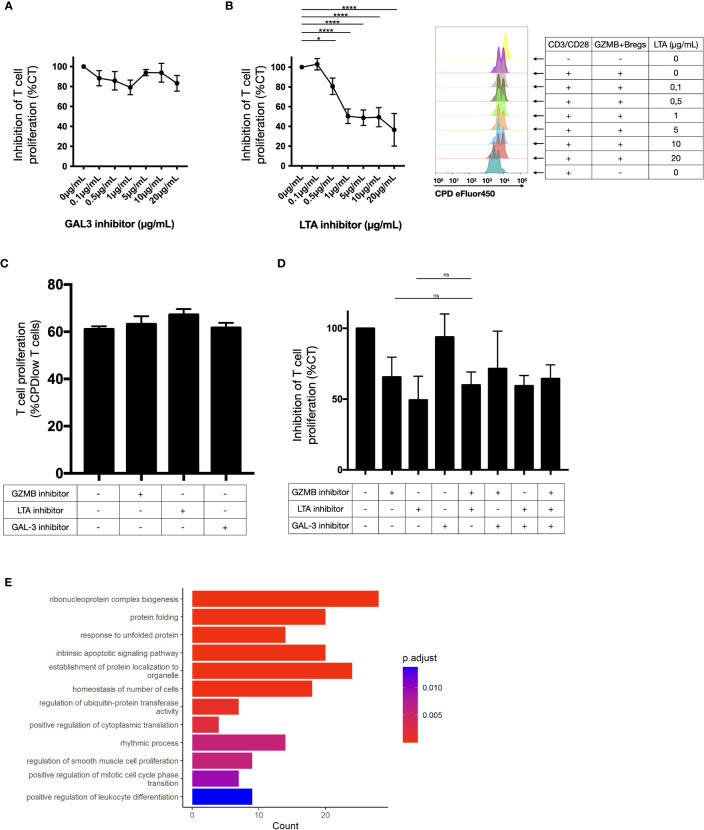
Figure 5.
Ligand activity on CD4+CD25- T cell proliferation. (A–D) T cell proliferation was measured by flow cytometry (as the percentage of CPD-low T cells) after 3 days-CD3/CD28 stimulation in presence of regulatory B cells in response of increasing doses of galectin 3 inhibitors in coculture assay (A) and LTA inhibitors in coculture assay with cytometry proliferation data for one representative donor (B), on T cells alone (C) and with different combinations of these inhibitors (D) in 6 healthy donors. The values were normalized to the inhibition induced by GZMB+Bregs without any inhibitor. On T cells alone, the proportion of cells that did one or more divisions was around 100% for each condition. That does not permit to visualize a potential proliferation induced by the inhibitors. Thus, we gated on cells that did two divisions or more. No significant difference was found between the CD3/CD28 stimulated T cells alone or with any of the inhibitors. Data represent mean ± SEM. ANOVA was performed with Tukey’s multiple comparison test. Differences were defined as statistically significant when P<0.05 (*) and P<0.0001 (****). (E) Gene ontology analysis was performed on the 45 genes downregulated in T cells and linked to LTA activity in the receptor-ligand analysis. Bar plots represent the number of gene and the adjusted pvalue associated to the ontologies.

