Figure 6.
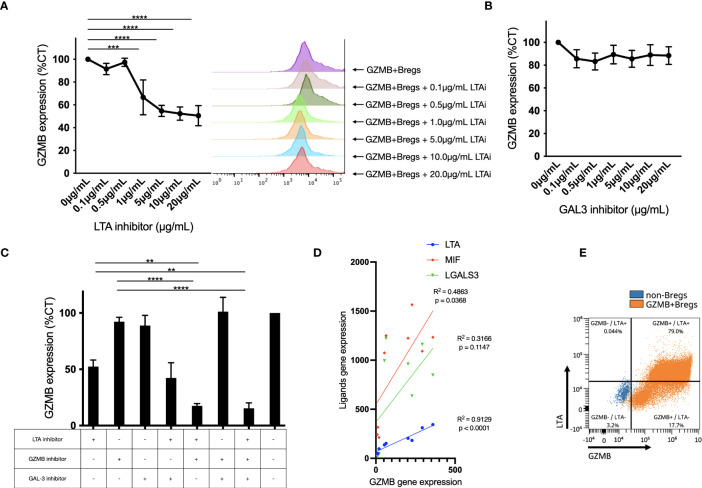
Ligand activity on regulatory B cells. (A-C) The expression of GZMB in regulatory B cells in response of increasing doses of LTA with cytometry data from one representative donor (A) and galectin 3 (B) inhibitors, and different combinations of these inhibitors (C) was assessed by flow cytometry in B cells after the 3-days Bregs induction for 6 healthy donors. For each donor, the mean fluorescent intensity was normalized to the condition without any inhibitor. (D) The correlation between GZMB mRNA expression and ligands mRNA expression (LTA, LGALS3 and MIF) was assessed using the nCounter® SPRINT Profiler in different B cell subsets (B cells enriched from blood, activated B cells in non-regulatory phenotype and GZMB+Bregs) in 3 different donors. LTA expression is highly correlated to GZMB (R2 = 0.9129) whereas MIF and LGALS3 were not/weakly correlated to GZMB (R2 = 0.4863 and 0.3166 respectively). (E) A representative FACS plot of 3 experiments for GZMB and LTA coexpression. Data represent mean ± SEM. ANOVA was performed with Tukey’s multiple comparison test. Differences were defined as statistically significant when P<0.01 (**), P<0.001 (***) and P<0.0001 (****). LTAi, LTA inhibitor Pateclizumab.

