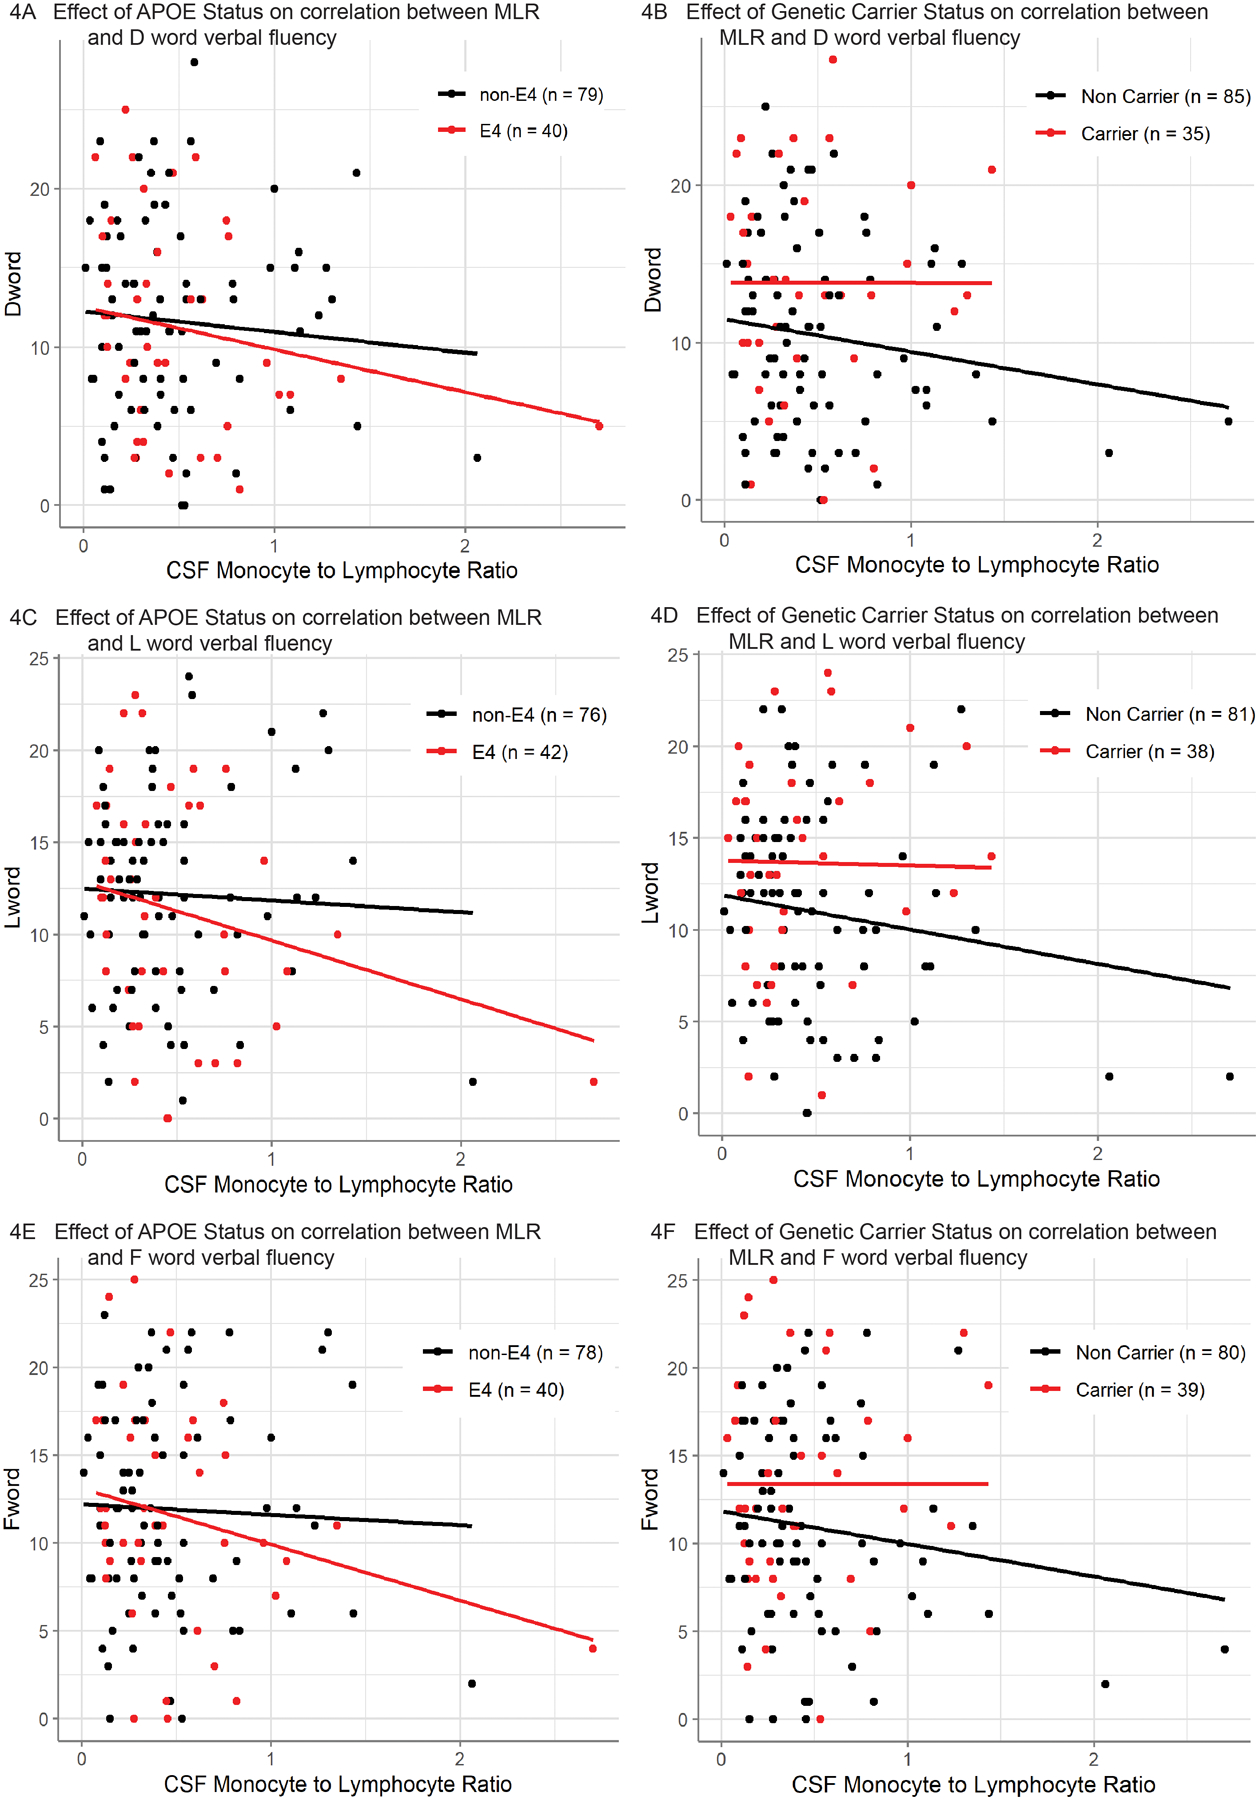
Figure 4: Correlation between CSF MLR and Measures of Executive Function.

Fig [4A-B]. Correlation between CSF monocyte-to-lymphocyte ratio and performance on [D Word] cognitive test after controlling for age, sex, education, and CDR Box Sum score as covariates. Additionally, the effect of (A) ApoE4 (n=119) or (B) monogenic disease carrier (n=120) statuses were also included (red: genetic mutation, black: no genetic mutation). Importantly, neither ApoE4 nor monogenic disease carrier status had a significant interaction with CSF monocyte-to-lymphocyte ratio on [D Word] performance. The plotted lines show the best fit for the corresponding model’s prediction of each subject. There was a significant negative correlation between CSF monocyte-to-lymphocyte ratio and [D Word] performance when ApoE4 status is included as a covariate (p < 0.05) and when monogenic disease carrier status was included as a covariate (p < 0.05).
Fig [4C-D]. Correlation between CSF monocyte-to-lymphocyte ratio and performance on [L Word] cognitive test after controlling for age, sex, education, and CDR Box Sum score as covariates. Additionally, the effect of (C) ApoE4 (n=118) or (D) monogenic disease carrier (n=119) statuses were also included (red: genetic mutation, black: no genetic mutation). Importantly, neither ApoE4 nor monogenic disease carrier status had a significant interaction with CSF monocyte-to-lymphocyte ratio on [L Word] performance. The plotted lines show the best fit for the corresponding model’s prediction of each subject. There was a significant negative correlation between CSF monocyte-to-lymphocyte ratio and [L Word] performance when ApoE4 status is included as a covariate (p < 0.05) and when monogenic disease carrier status was included as a covariate (p < 0.05).
Fig [4E-F]. Correlation between CSF monocyte-to-lymphocyte ratio and performance on [F Word] cognitive test after controlling for age, sex, education, and CDR Box Sum score as covariates. Additionally, the effect of (E) ApoE4 (n=118) or (F) monogenic disease carrier (n=119) statuses were also included (red: genetic mutation, black: no genetic mutation). Importantly, neither ApoE4 nor monogenic disease carrier status had a significant interaction with CSF monocyte-to-lymphocyte ratio on [F Word] performance. The plotted lines show the best fit for the corresponding model’s prediction of each subject. There was a significant negative correlation between CSF monocyte-to-lymphocyte ratio and [F Word] performance when ApoE4 status is included as a covariate (p < 0.05) and when monogenic disease carrier status was included as a covariate (p < 0.05).
