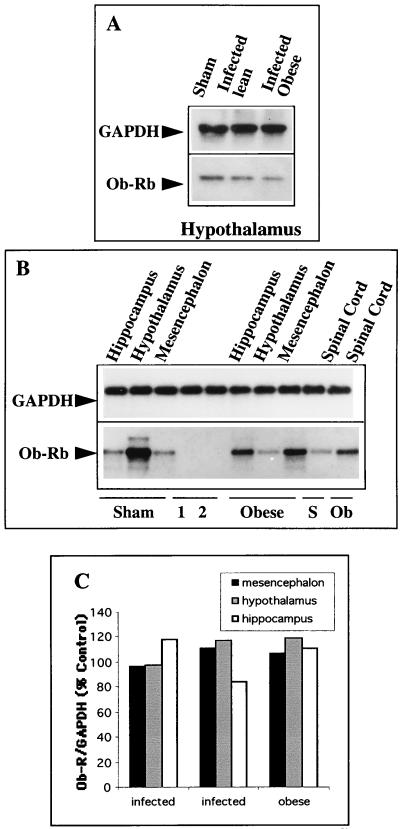
FIG. 5.
RT-PCR coamplification of leptin receptor and GAPDH genes during the late stage of infection. Total mRNAs (0.5 μg), extracted from infected (lean or obese) and sham-inoculated mice, were subjected to RT-PCR (26 to 30 cycles; 2 mM MgCl2) in a coamplification schedule (see the text), and the amplicons were loaded onto an agarose gel for electrophoresis, followed by electrotransfer and Southern blotting. The expected sizes were 487, 979, and 395 bp for Ob-Rb, GAPDH, and cyclophilin genes (Table 1). (A) RT-PCR of GAPDH and OB-Rb genes in the hypothalami of infected (lean and obese) and noninfected (sham-inoculated) Swiss mice (5 months p.i.). Quantification of the relative amount of Ob-Rb gene amplicon compared to the housekeeping gene amplicon (counts per minute of excised amplicons) indicates a decrease in Ob-Rb expression in the hypothalamus of an obese mouse similar (up to one-third) to that described in Table 4 for another experiment with the same hypothalamic RNAs as starting material, in which the values are expressed as pixels. (B) Coamplification of Ob-Rb and GAPDH in the hippocampus, mesencephalon, spinal cord, and hypothalamus of an infected obese Swiss mouse versus those of a sham-inoculated control (13 months p.i.) shows dramatic downregulation of the leptin receptor in the hypothalamus of the obese mouse concomitant with upregulation in other brain viral target structures. The data for the downregulation in the hypothalamus of the obese mouse (concomitant with upregulation in other brain structures) agree with those shown for obese Swiss mouse brains at 5 months p.i. (Table 4). 1 and 2, mRNA expression in an uninfected and an infected neuroblastoma cell line, respectively. (C) Expression of the leptin receptor Ob-R (common isoform) in the mesencephala, hypothalami, and hippocampi of infected obese and infected nonobese mice expressed relative to sham-inoculated Swiss mice (corresponding to 100%) at 5 months p.i. Similar levels are expressed irrespective of the mouse strain and brain structure, e.g., (averages as percentages of the controls), 104.8 ± 7.4, 111.5 ± 11.5, and 104.6 ± 17.9 for the mesencephalon, hypothalamus, and hippocampus, respectively.

