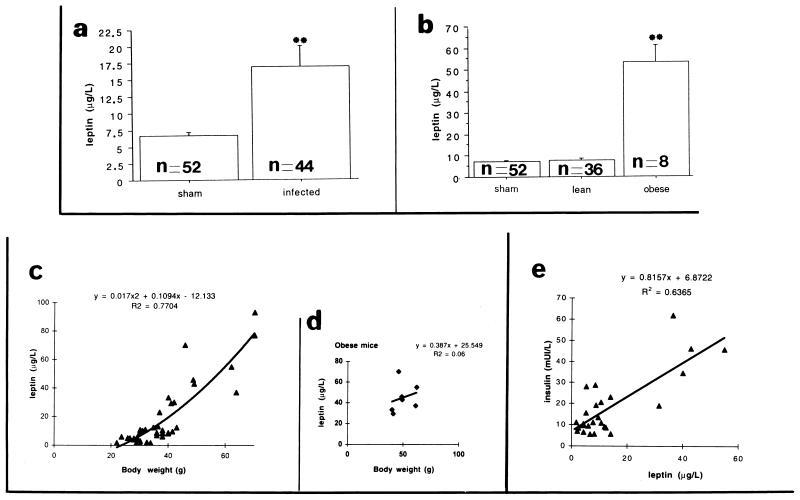
FIG. 7.
Effect of CDV infection on blood leptin levels over the following 13 months. The data are the means ± standard error for uninfected (n = 52) and infected Swiss mice, either taken as a whole (n = 44) (a) or separated into lean (n = 36) and obese (n = 8) groups (b). The average basal leptin levels in sham-inoculated and infected mice (taking all infected mice together) were 6.7 and 16.9 μg/liter, respectively (a). When the values for lean and obese infected mice were considered separately, a marked difference was seen between sham-inoculated and infected lean mice (7.1 and 7.8 μg/liter, respectively) and obese mice (53.4 μg/liter) (b). A significant difference (P < 0.0001) was found between obese and sham-inoculated or obese and lean mice by analysis of variance, Fisher, and Scheffe tests. The data show the relationship between blood insulin (results for 26 samples) and leptin levels (e) and between blood leptin level and body weight (c and d), respectively; no strict correlation is seen between insulin and leptin levels (R2 = 0.6365) or leptin levels and body weight (R2 = 0.7704). Moreover, there is no strict relationship between blood leptin levels and body weight (R2 = 0.06) for the seven samples obtained from the obese mice analyzed (d), indicating an independent change in these two parameters.

