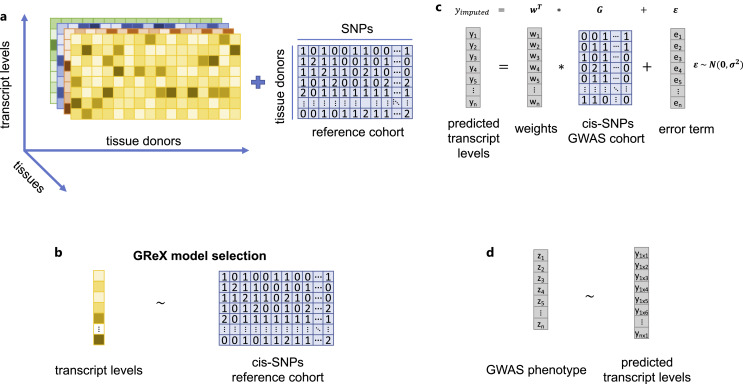
Fig. 5.
a Gene expression matrices have transcript-level measurement for each gene by rows. Columns are associated with individual donors for different tissues shown as color coded. The intensity of the color shows the amount of the transcript levels. b Transcriptome imputation relies on the eGene statistical prediction model to assign weights to each cis-eQTL. c These weights from GReX model will be used for imputing transcript levels. d TWAS is association between trait and predicted transcript level.

