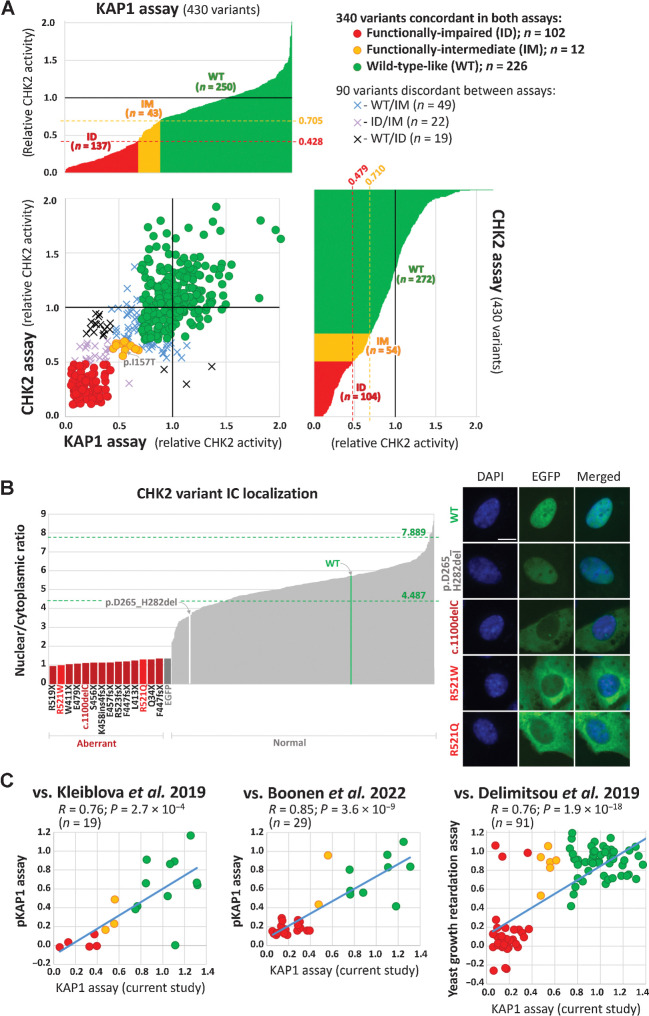
Figure 3.
Kinase KAP1 and CHK2 assays (A). The bar graphs show results of kinase assays for 430 CHEK2 missense variants. In both assays, variants with normalized relative CHK2 activity (mean WT-activity = 1) exceeding that of the weakest signal of WT replicas (not shown) were categorized functionally WT-like, variants with normalized signal intensity lower than the strongest signal for any of kinase-dead/empty EGFP vector controls (in-frame exon 7 deletion–p.D265_H282del; not shown) were categorized as functionally impaired. Variants with normalized CHK2 activities between these ranges were categorized functionally intermediate (0.428–0.705 and 0.479–0.710 for KAP1 and CHK2 assay, respectively; indicated by red and yellow dashed lines). Scatterplot combines results from both assays showing 340 concordant (circles) and 90 discordant (crosses) variants. The nuclear-to-cytoplasmic ratio (B) bar graph (left) displays all missense variants and a set of protein-truncating CHEK2 variants (dark red bars at left, zoomed part of the graph). The missense variants, p.R521W and p.R521Q, with an aberrant localization are highlighted as bright-red bars; the arrows denote WT (green bar) and catalytically-dead in-frame p.D265_H282del variant (white bar). The highest and lowest mean nuclear/cytoplasmic ratio values from all WT replicates are indicated by green dashed lines. Of all missense variants analyzed by ScanR microscopy, only codon 521 alterations revealed aberrant intracellular localization with intense cytoplasmic positivity (right), reminiscent of mislocalization of the c.1100delC (p.T367fsX; size bar, 10 μm) variant. In comparison, the in-frame deletion p.D265_H282del revealed normal intranuclear accumulation, similar to WT. C, Scatter plots depicting correlations between assays performed in this study and previous analyses of CHEK2 VUS. Studies of Kleiblova et al. (17) and Boonen et al. (18) used phosphorylation of KAP1 as a functional readout whereas the study of Delimitsou et al. (25) used a yeast growth retardation assay. The dots are colored according to the results of the KAP1 assay in this study (red, impaired; yellow, intermediate; green, wild-type–like). Blue line represents linear regression, R, correlation coefficient; P, P value. The scatter plot does not show the p.Arg512Trp variant classified by Boonen et al. as intermediate with impaired nuclear localization in our localization assay.

