. 2023 May 26;29(16):3142–3150. doi: 10.1158/1078-0432.CCR-23-0396

Figure 2.

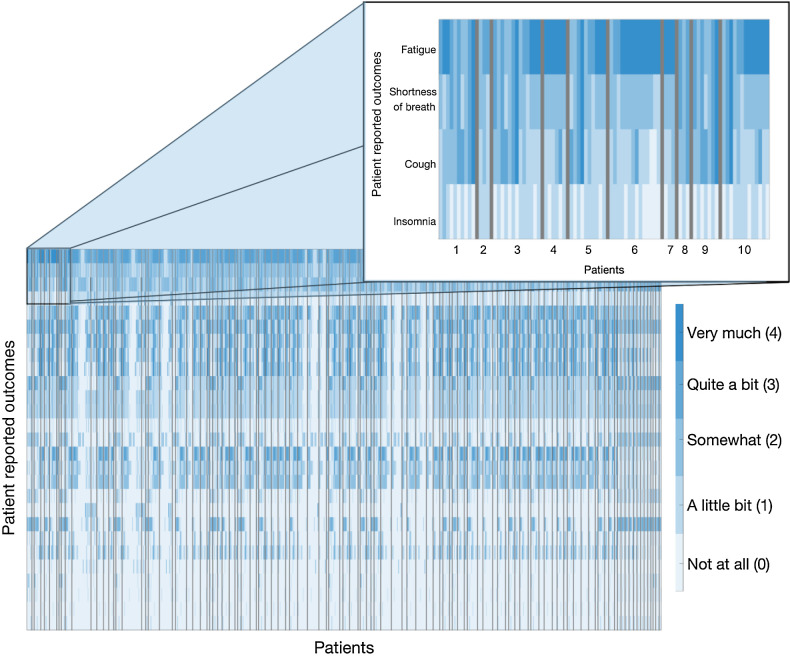
Figure 2. Study patient-reported outcomes. Individual symptoms are separated by rows and are ranked here in descending order of average severity experienced. Patient responses are based on Likert scale ranging from “not at all” (light blue) to “very much” (dark blue). Responses for individual patients are separated by black lines. Longitudinal responses are shown for each patient (left to right).

Study patient-reported outcomes. Individual symptoms are separated by rows and are ranked here in descending order of average severity experienced. Patient responses are based on Likert scale ranging from “not at all” (light blue) to “very much” (dark blue). Responses for individual patients are separated by black lines. Longitudinal responses are shown for each patient (left to right).