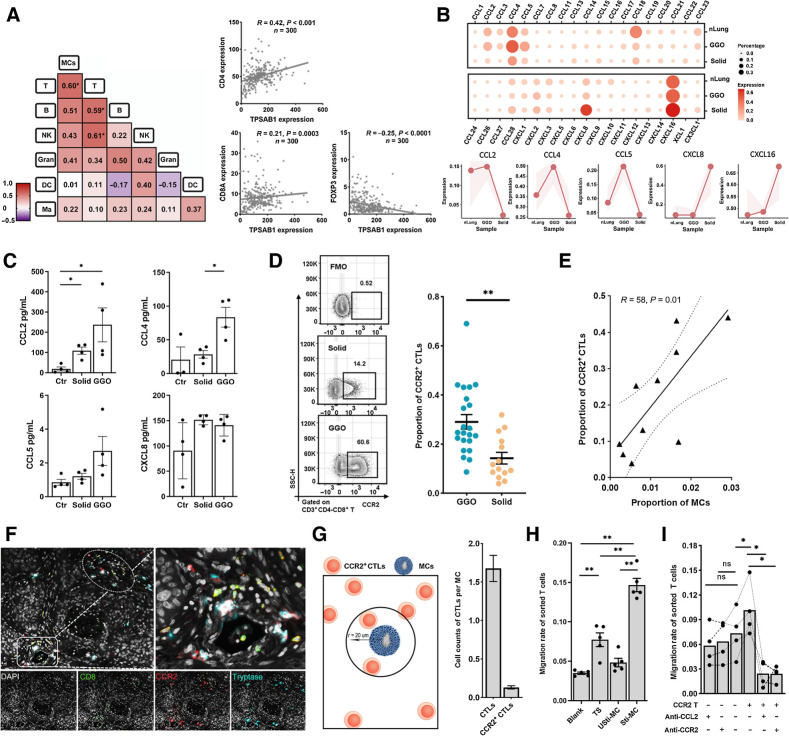
Figure 3.
MCs correlate with the infiltration of CCR2+ CTLs. A, Left, heat map showing the Pearson correlation of the immune cell population by FCM. Number representing the Pearson correlation index. Right, the transcriptional correlation of the transcriptional levels of MC marker (TPSAB1) and T-cell markers (CD4, CD8A, and FOXP3). B, The expression of chemokines in MCs from nLung, gLUAD, and sLUAD samples. The shaded areas represent the upper quantile and lower quantile. C, The secretion of CCL2, CCL4, CCL5, and CXCL8 by MCs detected by Luminex. Ctr, unstimulated MCs; solid, stimulated MCs from solid LUAD; GGO, stimulated MCs from GGO. D, Representative flow plots showing CCR2+ CTLs gating (left) and proportion of CCR2+ CTLs among tumor-infiltrating CTLs (right). FMO, fluorescence minus one. n = 36 (Mann–Whitney). E, Scatterplot showing the Pearson correlation of the proportion of CCR2+ CTLs (divided by the total CTL number) and MCs (divided by the total CD45+ cells) by FCM analysis (n = 10). F, Three-plex staining panel showing the spatial distribution of CCR2+ CTLs and MCs. G, Spatial analysis of the relationship between MCs and CTLs. Left, depiction of methodology for spatial analyses performed. The number of CTLs close to per MCs. H, The migration rate of CTLs (the ratio of migrated CTLs to total CTLs) in the transwell assay (n = 6, paired t test). Blank group, medium only; TS group, tumor supernatants; Usti-MC group, nonstimulated MCs; and Sti-MC group, stimulated MCs. I, The migration rate of CTLs (the ratio of migrated CTLs to total CTLs) in the migration blocking assay (n = 4, paired t test). CCR2 T−, CCR2− CTLs; CCR2 T+, CCR2+ CTLs. *, P < 0.05; **, P < 0.01; ns, nonsignificant.

