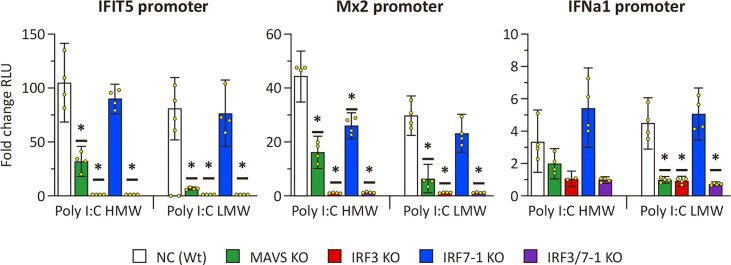
Figure 2.
ifit5, mx2, and ifna1 promoter activation in MAVS, IRF3, and IRF7-1 KO CHSE-214 cells 48 h after HMW or LWM poly I:C transfection. The graphs show the fold change of RLU (normalized against co-transfected Renilla plasmid) compared to non– poly I:C– transfected controls. Values of the quadruplicates visualized as dots, and error bars indicate 95% confidence interval. (*) Statistically significantly different from the wild-type NC. These data represent one of three repeated experiments which gave reproducible results.

