Figure 3.
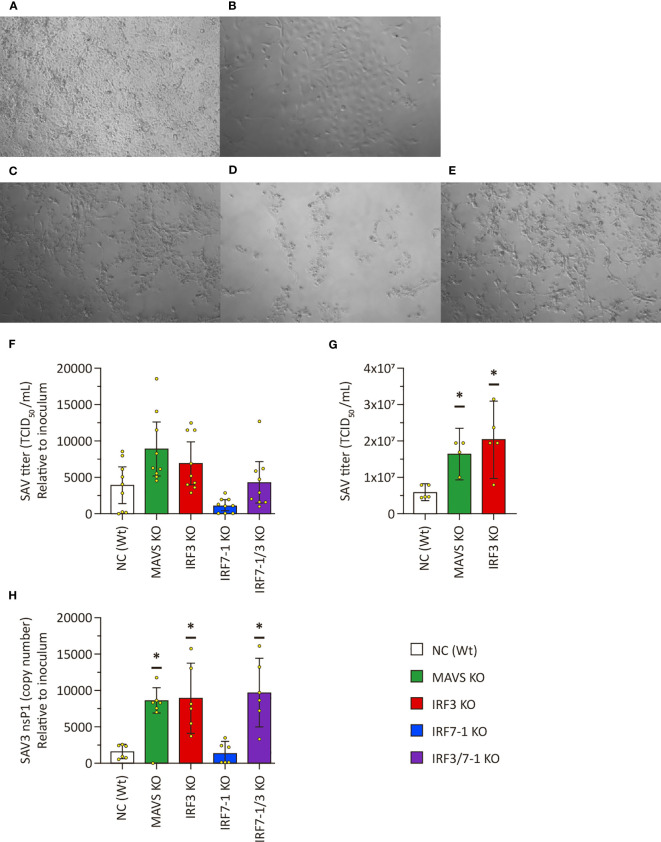
Salmonid alphavirus 3 (SAV3) growth on KO CHSE-214 cells. (A–E) Representative pictures of CPE on SAV3 -infected cells 6 dpi: NC (A), IRF7-1 KO (B), IRF3 KO (C), IRF7-1/3 KO (D), and MAVS KO (E). (F) SAV3 titers in supernatants of infected KO cells relative to the used inoculum at 6 dpi. (G) SAV3 titers in supernatants of infected KO cells with the same inoculum at 6 dpi. (H) SAV3 nsp1 transcript levels in supernatant of infected KO cells relative to the used inoculum at 6 dpi. Presented as # DNA copies (SAV3 nsp1) in 6 µl of cDNA from 12 µl of RNA isolate divided by the viral titer of the inoculum. Values of triplicates from three (viral titer F), one (viral titer G), or two (viral RNA H) experiments visualized as dots, and error bars indicate 95% confidence interval. (*) Statistically significantly different from the wild-type NC.

