
Figure 1. Increased centrosome displacement downstream of centrosome amplification requires kinesin‐1.
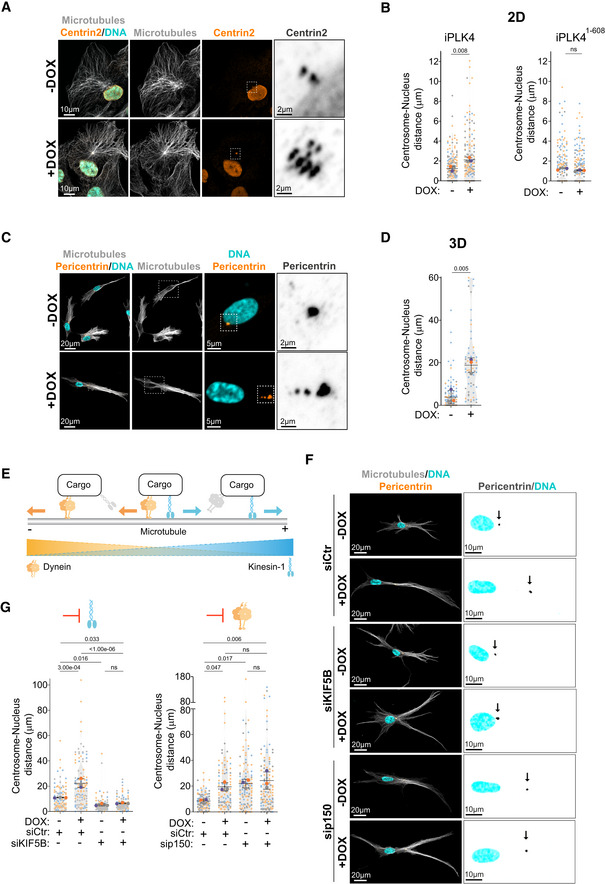
- Representative images of cells stained for centrosomes (Centrin2, orange), microtubules (α‐tubulin, gray), and DNA (Hoechst, cyan). Scale bar: 10 μm; inset scale bar: 2 μm.
- Quantification of centrosome‐nucleus distance in cells upon induction of PLK4 (Left panel; n (−DOX) = 174; n (+DOX) = 162) or PLK41‐608 overexpression (Right panel; n (−DOX) = 192; n (+DOX) = 203).
- Representative images of cells embedded in a 3D collagen matrix and stained for centrosomes (Pericentrin, orange), microtubules (α‐tubulin, gray), and DNA (Hoechst, cyan). Scale bar: 20 μm; inset DNA/Pericentrin scale bar: 5 μm; inset Pericentrin scale bar: 2 μm.
- Quantification of centrosome‐nucleus distance (n (−DOX) = 100; n (+DOX) = 62).
- Scheme recapitulating the balance forces mediated by kinesin‐1 (blue) and dynein (orange) along microtubules.
- Representative images of cells embedded in a 3D collagen matrix and stained for centrosomes (Pericentrin, orange), microtubules (α‐tubulin, gray), and DNA (Hoechst, cyan) treated with siRNA control (Ctr), siRNA KIF5B or siRNA p150. Scale bar: 20 μm. Black arrows indicate the position of the centrosome(s). Inset scale bar: 10 μm.
- Left panel, Quantification of centrosome‐nucleus distance upon KIF5B depletion (number of cells: n (−DOX siCtr) = 96; n (+DOX siCtr) = 108; n (−DOX siKIF5B) = 111; n (+DOX siKIF5B) = 91); Right panel, Quantification of centrosome‐nucleus distance upon p150 depletion (n (−DOX siCtr) = 102; n (+DOX siCtr) = 96; n (−DOX sip150) = 115; n (+DOX sip150) = 117).
Data information: For all graphs, error bars represent mean ± SD from three independent experiments. P‐values are described in the graphs, ns = not significant (P > 0.05). The following statistics were applied: unpaired t‐test for graphs in (B) and (D) and one‐way ANOVA with Tukey's post hoc test for graphs in (G). n = number of cells analyzed.
Source data are available online for this figure.