
Figure EV2. Centrosome amplification promotes mitochondria displacement and Golgi dispersion.
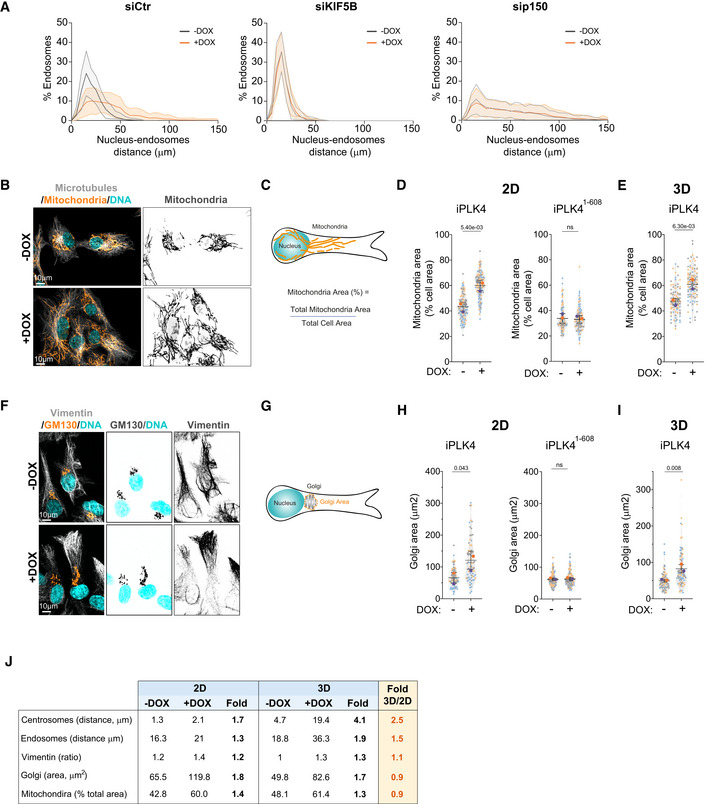
- Distribution of endosomes in cells upon depletion of KIF5B and p150 (n (−DOX siCtr) = 84; n (+DOX siCtr) = 81; n (−DOX siKIF5B) = 84; n (+DOX siKIF5B) = 83; n (−DOX sip150) = 82; n (+DOX sip150) = 83).
- Representative images of cells stained for mitochondria (MitoTracker, orange), microtubules (α‐tubulin, gray), and DNA (Hoechst, cyan). Scale bar: 10 μm.
- Representative scheme of mitochondria area quantification.
- Quantification of mitochondria area in cells plated in 2D upon induction of PLK4 (Left panel; n (−DOX) = 113; n (+DOX) = 114) or PLK41‐608 overexpression (Right panel; n (−DOX) = 95; n (+DOX) = 98).
- Quantification of mitochondria area in cells plated in 3D (n (−DOX) = 90; n (+DOX) = 102).
- Representative images of cells stained for Golgi (GM130, orange), vimentin (gray) and DNA (Hoechst, cyan). Scale bar: 10 μm.
- Representative scheme of Golgi area quantification.
- Quantification of Golgi area upon induction of PLK4 (Left panel; n (−DOX) = 94; n (+DOX) = 70) or PLK41‐608 overexpression (Right panel; n (−DOX) = 146; n (+DOX) = 133).
- Quantification of Golgi area in cells plated in 3D (n (−DOX) = 91; n (+DOX) = 83).
- Table summarizing the fold change between 2D and 3D conditions for the intracellular compartments analyzed.
Data information: For all graphs, error bars represent mean ± SD from three independent experiments. P‐values are described in the graphs, ns = not significant (P > 0.05). The following statistics were applied: unpaired t‐test for all graphs. n = number of cells analyzed.
Source data are available online for this figure.