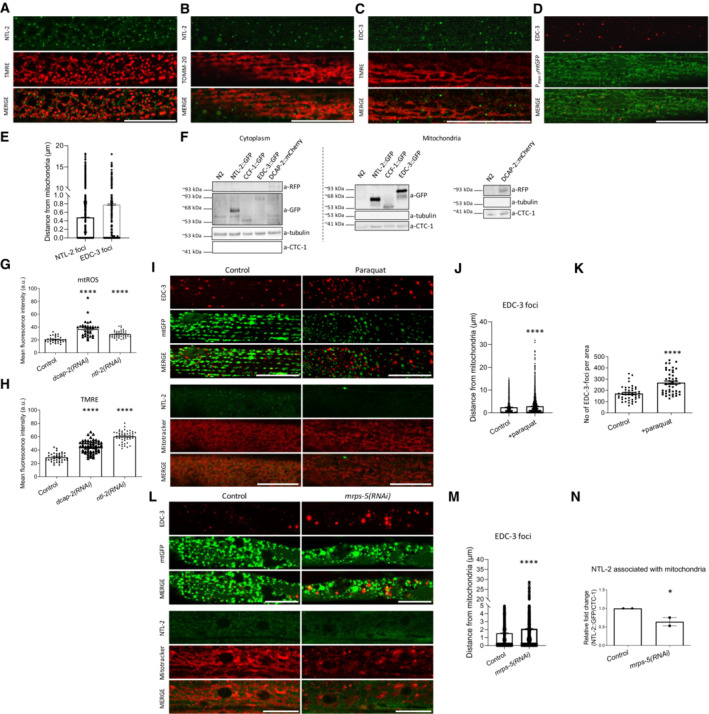
Figure 1. mRNA degradation and CCR4‐NOT complex components physically and functionally associate with mitochondria.

- NTL‐2 foci localize in close proximity to mitochondria in young adult animals; hypodermis is imaged (green: NTL‐2, red: TMRE (tetramethylrhodamine, ethyl ester, perchlorate), a mitochondrial membrane potential‐dependent dye) (n = 3 independent experiments).
- Localization of NTL‐2 foci relative to mitochondria in young adult animals; body wall muscle cells are imaged (green: NTL‐2, red: TOMM‐20, an outer mitochondrial membrane (OMM) protein marker of mitochondria) (n = 3 independent experiments).
- EDC‐3 foci localize in close proximity to mitochondria in young adult animals; body wall muscle cells are imaged (green: EDC‐3, red: TMRE) under control conditions (n = 3 independent experiments).
- Localization of EDC‐3 foci relative to mitochondria in young adult animals; body wall muscle cells are imaged (red: EDC‐3, green: mitochondrial matrix targeted by GFP) (n = 3 independent experiments).
- Quantification of NTL‐2 and EDC‐3 foci (shown in dots) with depicted distances from mitochondria is shown (n = 3 independent experiments) based on experiments presented in images (A–D).
- Immunoblot analysis of the cytoplasmic and mitochondria‐containing fractions obtained from whole animal extracts, showing that NTL‐2, CCF‐1, EDC‐3 and DCAP‐2 are localized in the cytoplasm and co‐precipitate with mitochondria (n = 3 independent experiments).
- Mitochondrial ROS production is elevated in animals subjected to either dcap‐2 or ntl‐2 RNAi, as evidenced by staining with Mitotracker Red CM‐H2X ROS (n = 3 independent experiments with at least 113 animals/experiment; ****P < 0.0001; one‐way analysis of variance (ANOVA)).
- Mitochondrial membrane potential (Δψ) is increased in animals subjected to either dcap‐2 or ntl‐2 RNAi as evidenced by TMRE staining (n = 3 independent experiments with at least 144 animals/experiment; ****P < 0.0001; one‐way analysis of variance (ANOVA)).
- EDC‐3 and NTL‐2 foci lose their specific localization close to mitochondria upon paraquat treatment of transgenic animals expressing mitochondria‐targeted GFP; top: EDC‐3 foci, bottom: NTL‐2 foci (n = 3 independent experiments).
- Measurement of the distances between EDC‐3 foci (shown in dots) and mitochondria under paraquat treatment as compared with their control counterparts (n = 3 independent experiments with at least 30 animals/experiment; ****P < 0.0001; two‐tailed unpaired t‐test).
- EDC‐3 foci are increased upon paraquat treatment (n = 3 Independent experiments with at least 30 animals/experiment; ****P < 0.0001; two‐tailed unpaired t‐test).
- EDC‐3 and NTL‐2 foci lose their specific localization in the vicinity of mitochondria upon genetic inhibition of mrps‐5; top: EDC‐3 foci, bottom: NTL‐2 foci (n = 3 independent experiments).
- Measurement of the distances between EDC‐3 foci (shown in dots) and mitochondria upon genetic inhibition of mrps‐5 as compared to control (n = 3 independent experiments with at least 30 animals/experiment; ****P < 0.0001; two‐tailed unpaired t‐test).
- Quantification of NTL‐2 protein bound on mitochondria under control conditions and upon genetic inhibition of mrps‐5 (western blot shown in Fig 5E, n = 2 independent experiments; *P < 0.05; one‐way analysis of variance (ANOVA) followed by Dunnett's test).
Data information: Images were acquired using an ×63 objective lens. Scale bars, 20 μm. Error bars denote SEM.
