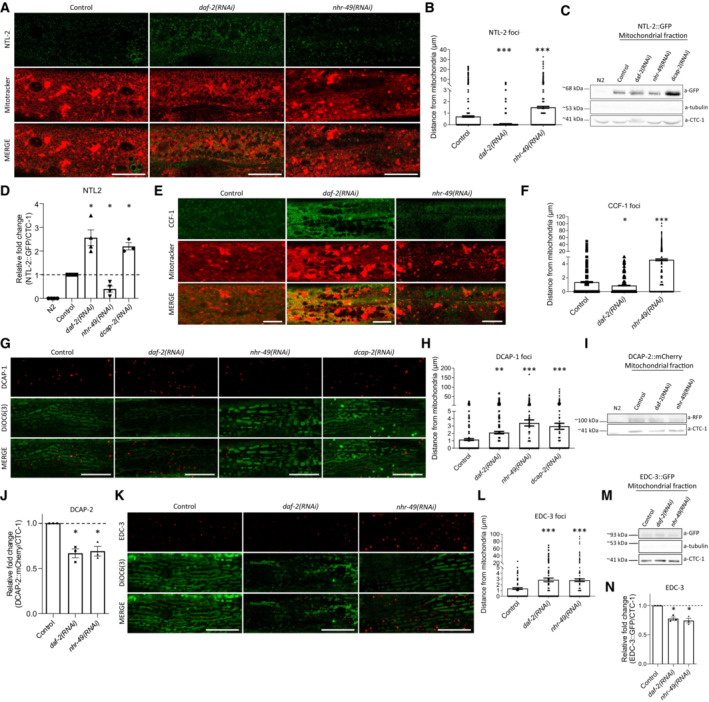
Figure EV2. Association of the CCR4‐NOT and the mRNA degradation complex components with mitochondria is tightly and differentially regulated in long‐ and short‐lived animals.

- Representative images showing the localization of NTL‐2 foci relative to mitochondria upon genetic inhibition of either daf‐2 known to extend lifespan or nhr‐49 known to shorten lifespan (green: NTL‐2, red: Mitotracker Deep Red FM, a mitochondria‐specific dye).
- Quantification of the distances NTL‐2 foci obtain from mitochondria upon genetic inhibition of daf‐2 or nhr‐49 (n = 3 independent experiments with at least 45 animals/experiment; ***P < 0.001; one‐way analysis of variance (ANOVA)).
- Immunoblot analysis in isolated mitochondria of 1‐day‐old animals showing the protein levels of NTL‐2 present in the mitochondrial isolate derived from animals under control conditions and upon the indicated genetic inhibitions.
- Quantification of western blot presented in B (n = at least 3 independent experiments; *P < 0.05; Welch's one‐way analysis of variance (ANOVA) followed by Dunnett's T3 multiple‐comparisons test).
- Representative images showing the localization of CCF‐1 foci relative to mitochondria upon genetic inhibition of daf‐2 or nhr‐49 in day 1 adults; image in control is reused in Appendix Fig S3A as conditions shown in Appendix Fig S3A and (E) are part of the same experimental setup (green: CCF‐1, red: Mitotracker Deep Red FM, a mitochondrial‐specific dye).
- Quantification of the distances CCF‐1 foci obtain from mitochondria upon genetic inhibition of daf‐2 or nhr‐49 (n = 3 independent experiments with at least 45 animals/experiment; *P < 0.05, ***P < 0.001; one‐way analysis of variance (ANOVA)).
- Representative images showing the localization of DCAP‐1 foci relative to mitochondria upon genetic inhibition of daf‐2, nhr‐49 or dcap‐2 (red: DCAP‐1, green: DiOC6(3), a mitochondria‐specific dye).
- Quantification of the distances DCAP‐1 foci obtain from mitochondria upon genetic inhibition of daf‐2, nhr‐49 or dcap‐2 (n = 3 independent experiments with at least 45 animals/experiment; **P < 0.01, ***P < 0.001; one‐way analysis of variance (ANOVA)).
- Immunoblot analysis in isolated mitochondria of 1‐day‐old animals showing the protein levels of DCAP‐2 present in the mitochondrial isolate in control conditions and upon the indicated genetic inhibitions.
- Respective quantifications (n = at least 3 independent experiments; *P < 0.05; Welch's one‐way analysis of variance (ANOVA) followed by Dunnett's T3 multiple‐comparisons test).
- Representative images showing the localization of EDC‐3 foci relative to mitochondria upon genetic inhibition of daf‐2 or nhr‐49 in day 1 adults (red: EDC‐3, green: DiOC6(3), a mitochondria‐specific dye; image in control is reused in Fig EV1E as conditions shown in Figs EV1E and (K) are part of the same experimental setup).
- Quantification of the distances EDC‐3 foci (shown in dots) obtain from mitochondria upon genetic inhibition of daf‐2 or nhr‐49 (n = 3 independent experiments with at least 45 animals/experiment; ***P < 0.001; one‐way analysis of variance (ANOVA)).
- Immunoblot analysis in isolated mitochondria of 1‐day‐old animals showing the protein levels of EDC‐3 present on mitochondria in control conditions and upon the indicated genetic inhibitions.
- Respective quantification (n = 3 independent experiments; *P < 0.05; Welch's one‐way analysis of variance (ANOVA) followed by Dunnett's T3 multiple‐comparisons test).
Data information: Images were acquired using a ×63 objective lens. Scale bars, 20 μm. Error bars denote SEM.
