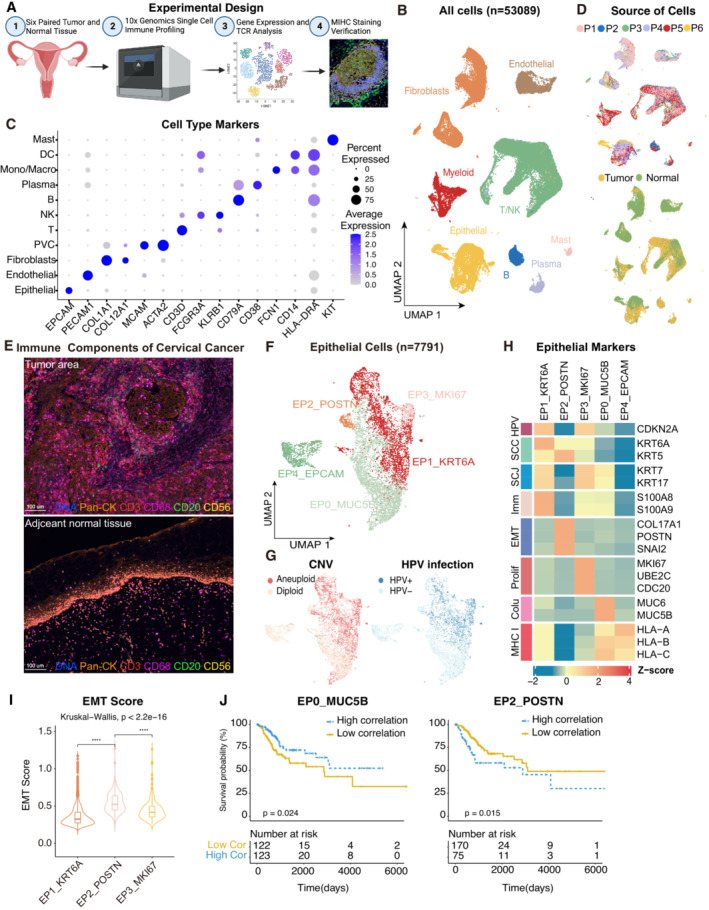
Experimental design of primary cervix tumor collection, processing, sequencing and data analysis; Created with
BioRender.com.
UMAP plot of all the 53,089 single cells from 6 cervical cancer patients. Cells were annotated based on known lineage‐specific marker genes (denoted by colors).
Dot plot showing the lineage‐specific marker genes of T and NK cells (T/NK), B cells, Plasma, Myeloid cells, Mast cells, Fibroblasts, Perivascular cells (PVC), Endothelial and Epithelial cells. The shade of color denotes the average gene expression level, the dot size denotes the percentage of gene expression in the corresponding lineage.
UMAP plot of single cells profiled in the presenting work colored by patient (upper panel) and sample source (lower panel).
Representative mIHC of immune components in CC tumors and adjacent normal tissues. T cells: CD3 (red), B cells: CD20 (green), macrophages: CD68 (pink), NK cells: CD56 (yellow), epithelial cells: Pan‐CK (orange). Scale bar = 100 μm.
UMAP plot showing the subtypes of 7,791 epithelial cells. Cluster annotations are denoted and colored corresponding to the cell type in the figure.
UMAP plot showing the distribution of CNV and HPV infection status (indicated by colors).
Heatmap showing the expression of marker genes in each subtype of epithelial cells. SCC, squamous cell carcinoma; SCJ, squamocolumnar junction; Imm, immune‐related genes; Prolif, hyperproliferation; Colu, columnar epithelium; EMT, epithelial‐mesenchymal transition.
Violin plot indicating the EMT Score of three malignant cell clusters; Differences between group were examined by Kruskal‐Wallis test. ****P < 0.0001 by pairwise Wilcoxon tests with the Benjamini‐Hochberg correction.
Comparison of Overall survival (OS) rates for the high‐correlation and low‐correlation groups, stratified using the EP0_MUC5B (left panel) and EP2_POSTN (right panel) signatures in TCGA. P‐values are calculated using the log‐rank test (N = 255).

