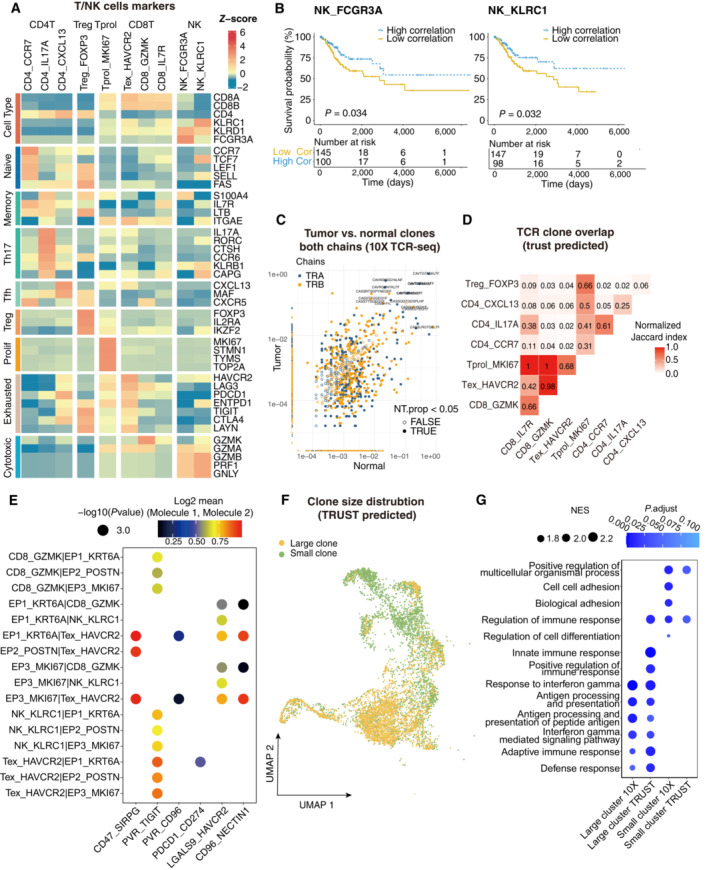
Figure EV2. The clinical function of NK cells and TCR repertoire profiling using TRUST predicted data.

- Heatmap showing the expression of marker genes in each subtype of T/NK cells.
- Comparison of Overall survival (OS) rates for the high‐correlation and low‐correlation groups, stratified using the NK_FCGR3A (left panel) and NK_KLRC1 (right panel) signatures in TCGA. P‐values are calculated using the log‐rank test (N = 255).
- Representative example of tumor versus normal clones from 10× TCR data, showing both chains, with filled points representing clones suggesting a significant change in frequency.
- Triangle heatmap showing the overlap of expanded TCR clonotypes across all possible combinations of T cell clusters. Data were aggregated for each of the indicated patient groups from TRUST predicted TCR data. Numbers indicate the normalized Jaccard index number of shared expanded TCR clonotypes for each cluster pair.
- Bubble plots showing the interactions between epithelial cells and T/NK cell populations using CellPhoneDB.
- UMAP as in Fig 2A, but clones from TRUST predicted TCR data.
- Dot plot showing the selected signaling pathways (rows) with significant enrichment of GO terms for large clones and small clones identified by 10× or predicted by TRUST (Related to Fig 2).
