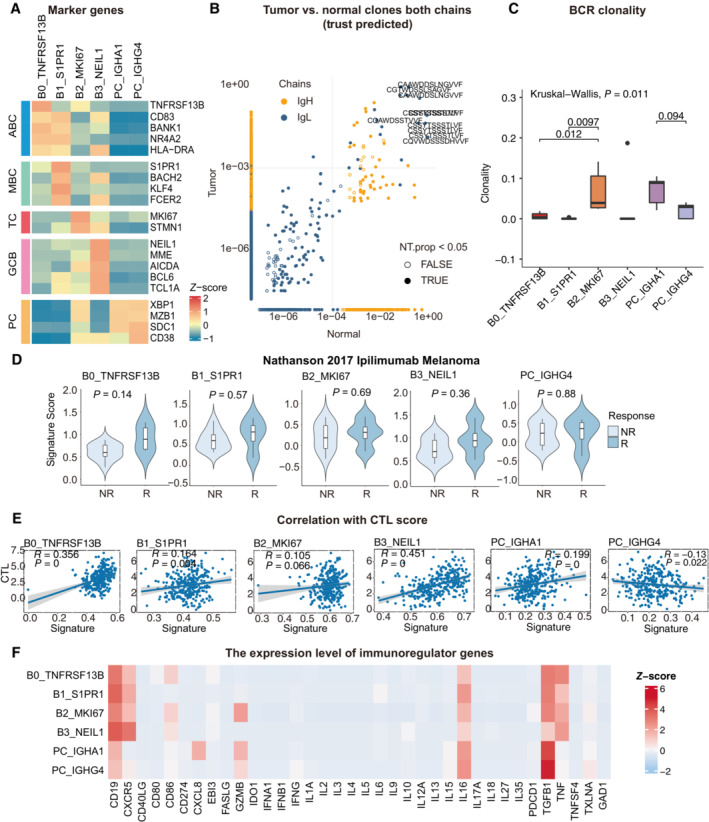
Figure EV3. Clinical performance of B cell populations and BCR repertoire profiling using TRUST predicted data.

- Heatmap showing the expression of marker genes in each subtype of B cells.
- Representative example of tumor versus normal clones from TRUST predicted BCR data, showing both chains, with filled points representing clones suggesting a significant change in frequency.
- Boxplots showing each cell type BCR Clonality level for matched tumor and normal samples by using TRUST predicted BCR data. Student's t‐test, P < 0.05 was considered statistical significance.
- Violin plots showing the association of different B‐cell signatures with the response (R, N = 4) and no response (NR, N = 11) to Ipilimumab in the Nathanson 15 cohort. P‐values calculated using the student's t‐test.
- Scatter plot showing the correlation between the bulk sample with CTL score and the single‐cell B cell clusters.
- Heatmap showing the expression level of immunoregulator genes in B‐cell populations.
Data information: Boxplots show the median and upper/lower quartiles (Related to Fig 3).
