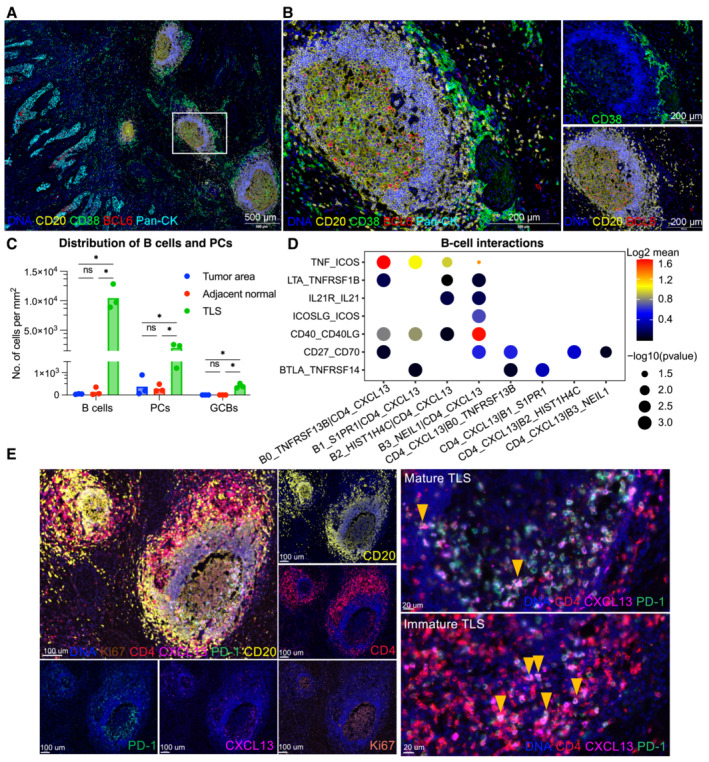
Figure 4. Localization and interactions of B cells and TLS in CC.

-
A, BB cell subsets localization in CC tissues are exhibited by mIHC via differential markers as follow: total B cell: CD20+, GCB: CD20+BCL6‐, PC: CD20‐CD38+; with scale =500 μm for (A), scale = 200 μm for (B).
-
CQuantification of B‐cell density in Pan‐CK+ tumor area, adjacent stroma and TLS. *P < 0.05, two‐way ANOVA following Tukey post‐hoc test.
-
DBubble plots showing the interactions between Tfh (CD4_CXCL13) and B‐cell populations using CellPhoneDB.
-
ERepresentative mIHC of CC tumor with CD4+PD‐1+CXCL13+ Tfh cells located in TLS (yellow arrows). scale bars = 100 μm for left panel, scale bars = 20 μm for right panel.
