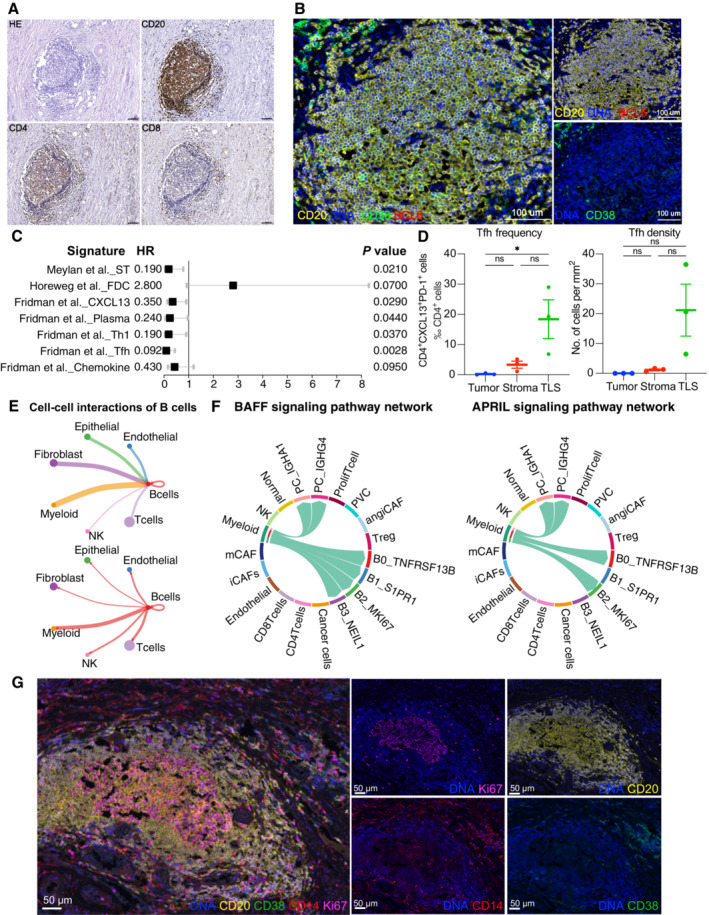
Cellular compositions of TLS are exhibited by immunohistochemistry. Scale = 100 μm.
B‐cell subsets are exhibited by mIHC via differential markers as follows: total B cell: CD20+, GCB: CD20+BCL6−, PC: CD20−CD38+. Scale = 100 μm.
A forest plot showing the association of TLSs‐associated signatures with survival across the TCGA SCC cohort (n = 255). Squares and lines indicate hazard ratios (HRs) and 95% confidence intervals (CIs), respectively. HRs calculated using univariable Cox regression; P‐values calculated using log‐rank test; ST, spatial transcriptomics.
Scatter plots showing the frequency and density of Tfh cells (CD4+PD‐1+CXCL13+) in TLSs, tumor and stroma (n = 3). Represented Mean ± SEM. P‐value was measured by the Holm–Sidak's multiple comparisons test, *P < 0.05.
Circle plots showing the number of interaction weights between B cell groups and other cell groups. Edge colors are consistent with the sources as the sender, and edge weights are proportional to the interaction strength. A thicker edge line indicates a stronger signal.
Chord diagram showing the communication networks of APRIL (left panel) and BAFF (right panel) signaling pathways. Arrows indicate the interactions (signaling pathways) from some cell groups to other cell groups.
Representative mIHC of CD14
+ cell localization in TLS. Scale bars are 50 μm (Related to Fig
4).

