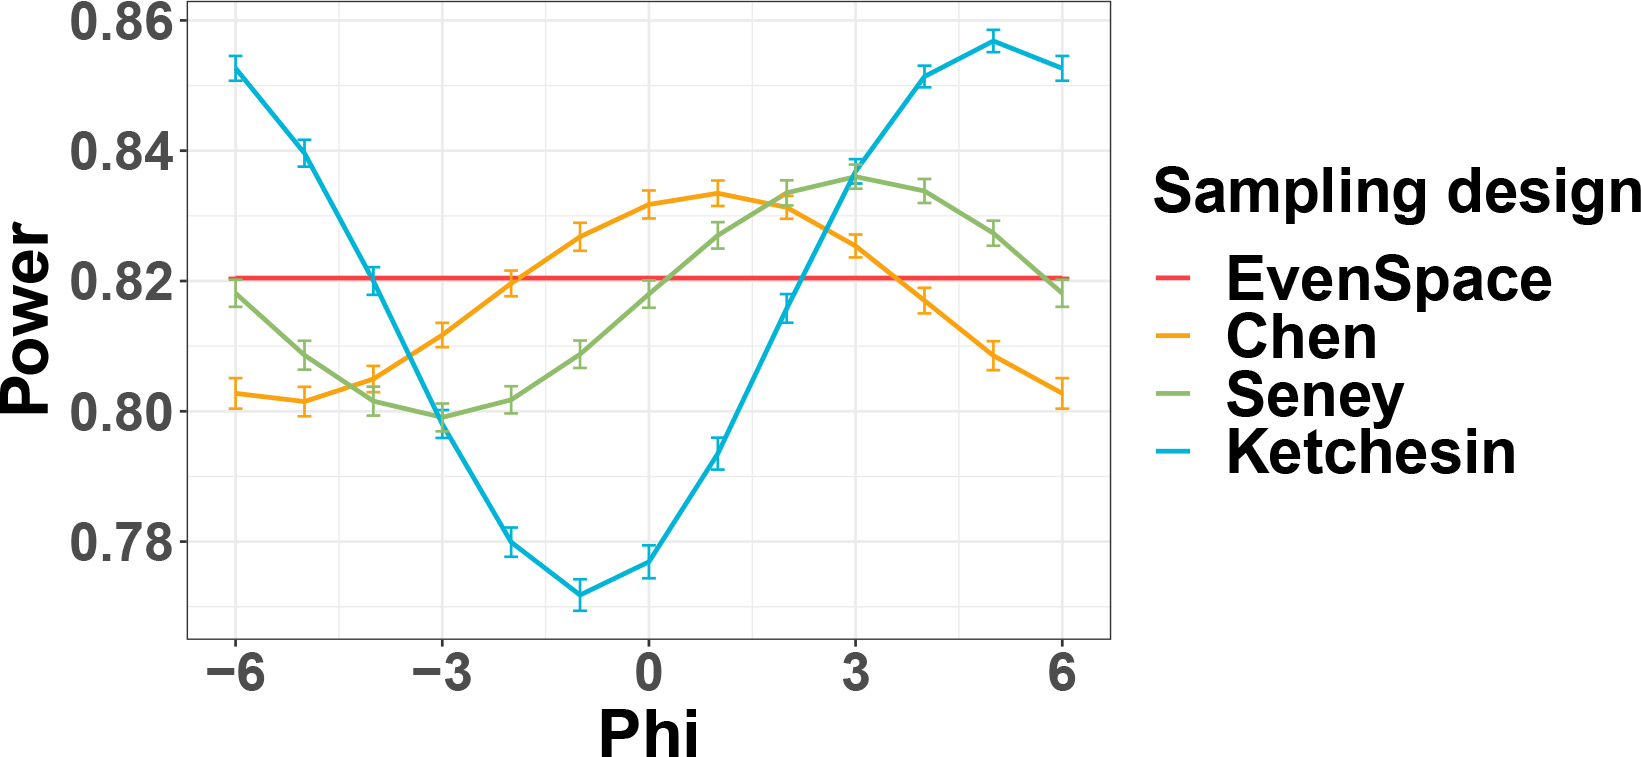
Figure E5.

The mean power trajectories across different when and . For each and sampling distribution, we draw sampling times 1000 times and calculate corresponding power. Vertical bars indicate the 95% confidence interval of power estimates calculated form where and are mean and standard deviation of power estimates respectively. Maximum power drop ) is 3.8%, 4.4%, and 9.9% respectively.
