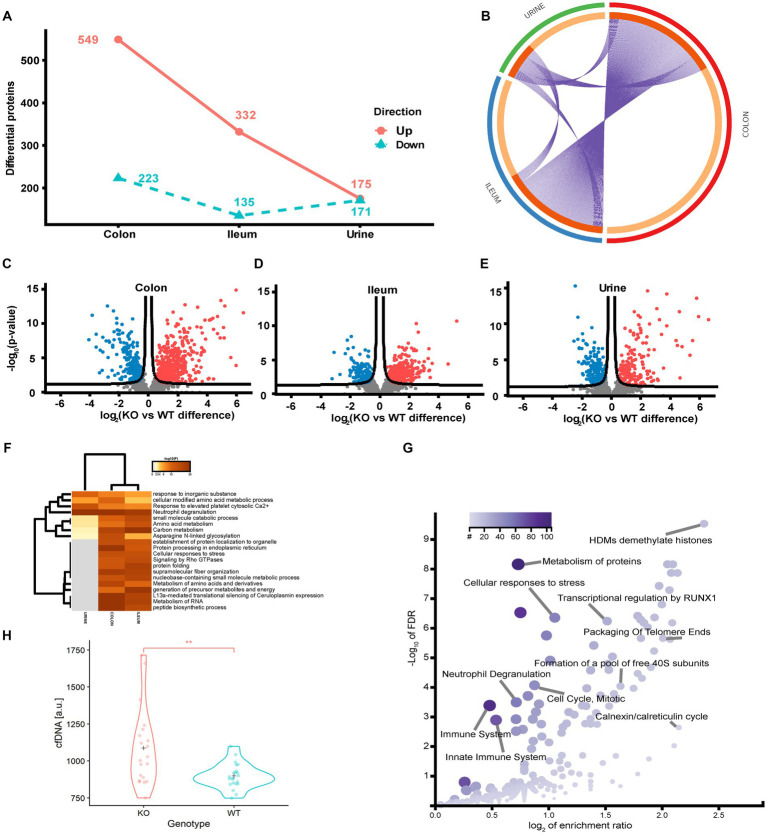
Figure 4.
Quantitative proteome analysis of the Abcb1 KO model and comparison of the colon, ileum and urinary proteomes. (A) Summary of the significantly up and down regulated protein within the analyzed proteomes. (B) Overlap of groups in the distinct proteomes. Dark orange color represents the proteins that appear in multiple lists and light orange color represents proteins that are unique to colon, ileum or urine. Purple lines link the protein shared by multiple lists. (C-E) Quantitative comparisons (log-fold-change) based on multiple-hypothesis testing indicating the number of specific proteins that were uniquely regulated within the two tissues colon, ileum and urine significant proteins of the colon, ileum, and urinary samples. (F) Statistically enriched terms (GO/KEGG, canonical pathways, hall mark genes) across the three proteomes. (G) scatterplot of enriched GO Biological process groups with indication of relevant processes. (H) Increase in plasma cell free DNA by NETs associated neutrophil degranulation (p-value = 0.002).

