Figure 5.
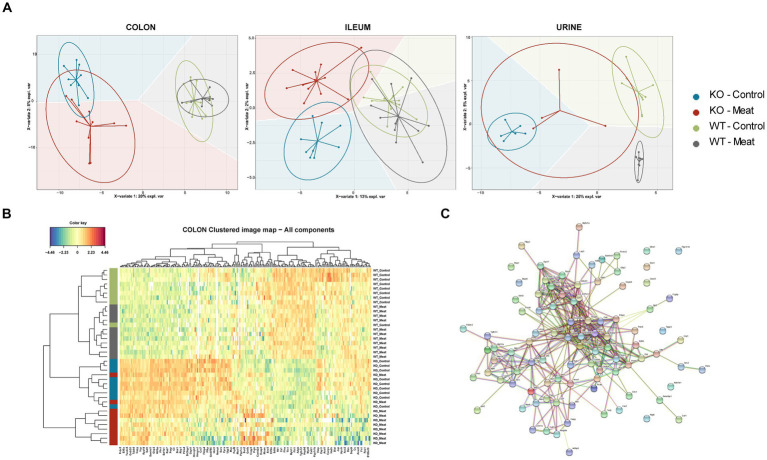
Regional Abcb1 expression in the KO model and comparison of the colon, ileum and urinary samples shows distinct proteome profiles. (A) A supervised model, sparse Partial Least Squares-Discriminant Analysis (sPLS-DA) was used to identify discriminative proteins in the proteomes of the four animal groups. Colored background indicates the computed prediction background for predicting class of samples. (B) Hierarchical clustering of regulated proteins in colon reveals the most important variables for discriminating between the groups, showed a clustering of all four groups. (C) Protein–protein interaction network analysis of discriminative proteins between wildtype and knockout groups by STRING.

