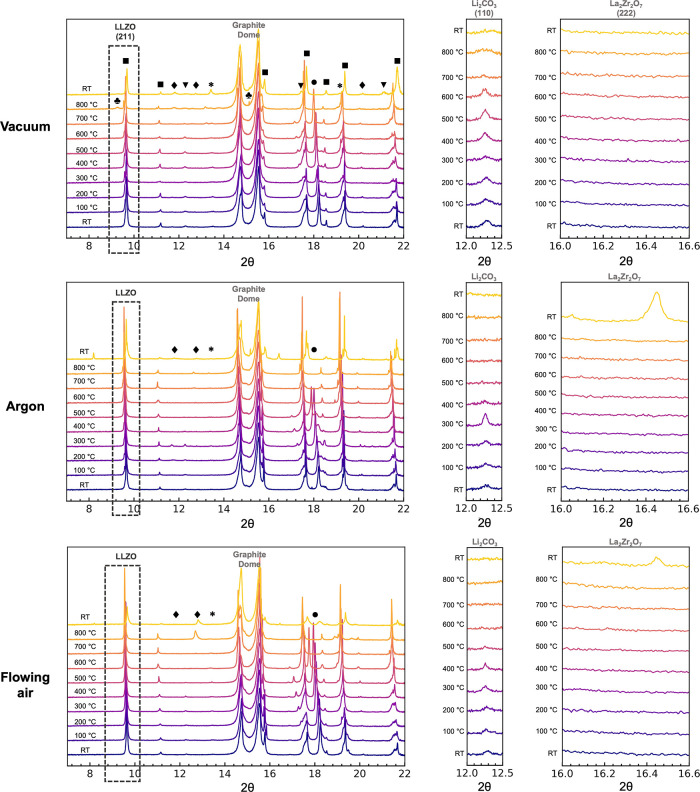
Figure 1.
GIXRD (λ = 0.8856 Å) patterns of air-exposed samples heated under different gas environments from RT to 800 °C in 100 °C increments and then cooled to RT. The second and third columns of images are the enlarged versions of the regions corresponding to Li2CO3 (110) and La2Zr2O7 (222) reflections, respectively. The black dotted-line box and ■ represent LLZO reflections, ⧫ represents Li2ZrO3, * represents LaAlO3, ● represents LiOH, and ▼ represents Li2CO3. The peaks represented by ★ in the vacuum case at 800 °C could not be indexed to any known compound, and these peaks disappear upon cooling to RT. The shift in the LLZO (211) peaks toward lower 2θ as the sample is heated is due to thermal lattice expansion; sharp discontinuities in the reflections of all the phases are seen between the patterns collected at 800 °C and RT due to rapid lattice contractions.

