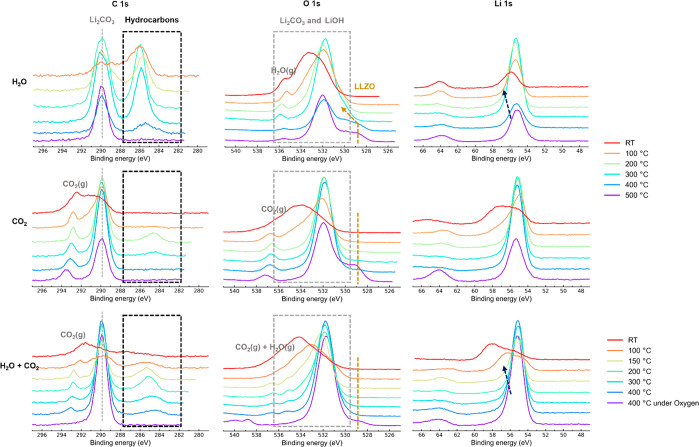
Figure 3.
C 1s and O 1s XPS spectra of LLZO during cooling from 500 °C to RT under different gas environments. The gray dotted line represents Li2CO3, the golden dotted line represents LLZO, the black dotted-line box represents additional hydrocarbon-related species on the surface, and the dark blue dotted line represents LiOH.

