
Figure 3.
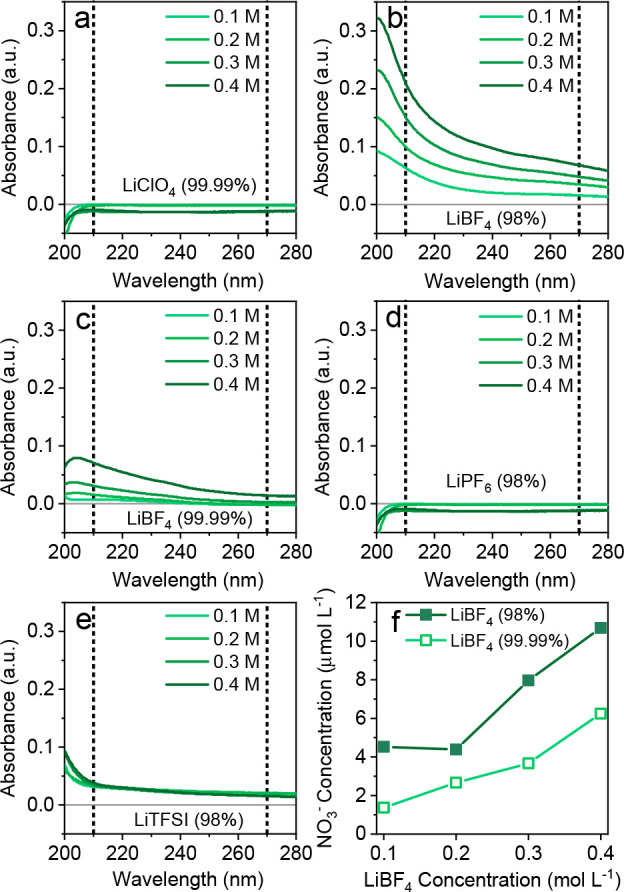
NO3– assay showing UV spectra at different salt concentrations of (a) LiClO4 (99.99%, Sigma), (b) LiBF4 (98%, Sigma), (c) LiBF4 (99.99%, Sigma), (d) LiPF6 (98%, Honeywell), and (e) LiTFSI (98%, Sigma). (f) NO3– concentrations as a function of the LiBF4 concentration.