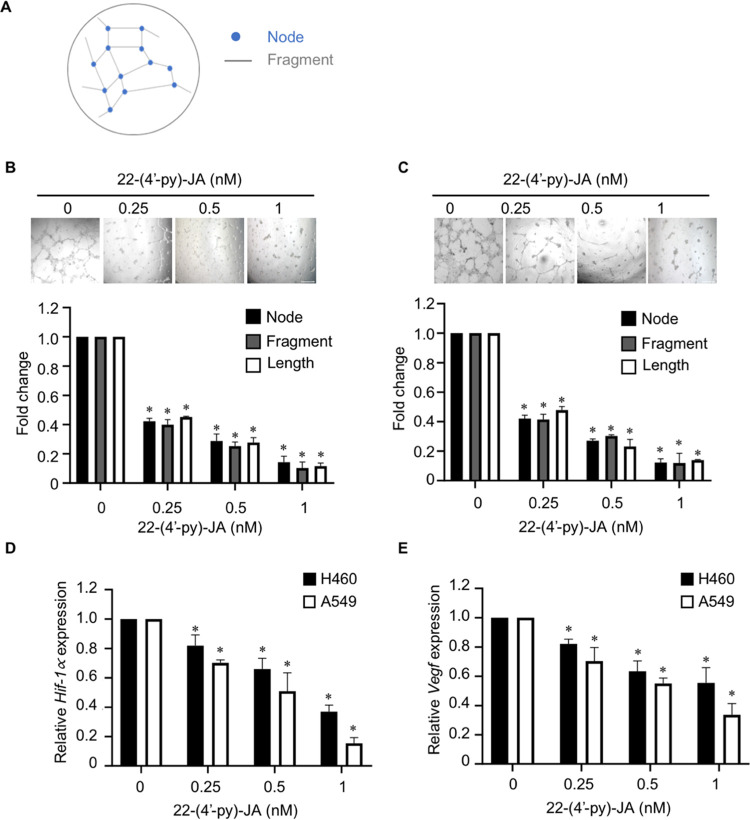
Figure 3.
Effects of 22-(4′-py)-JA on tube formation in HUVECs. (A) Schematic diagram demonstrates the parameters for tube formation analysis (i.e., the number of nodes and fragments and their length). HUVECs were treated with the medium obtained from (B) H460 cells and (C) A549 cells. After 24 h, tube formation was imaged, and its parameters were quantified using ImageJ software. Plots present the fold change of node number, fragment number, and fragment length. Scale bar, 100 μm. Bar graphs showing the mRNA expression levels of (D) Hif-1α and (E) Vegf in H460 and A549 cells incubated with or without a nontoxic dose of of 22-(4′-py)-JA for 24 h. Data are presented as mean ± SEM (n = 3). *p < 0.05 vs untreated control group. All data were analyzed by using analysis of variance (ANOVA) followed by the Tukey post hoc test.

