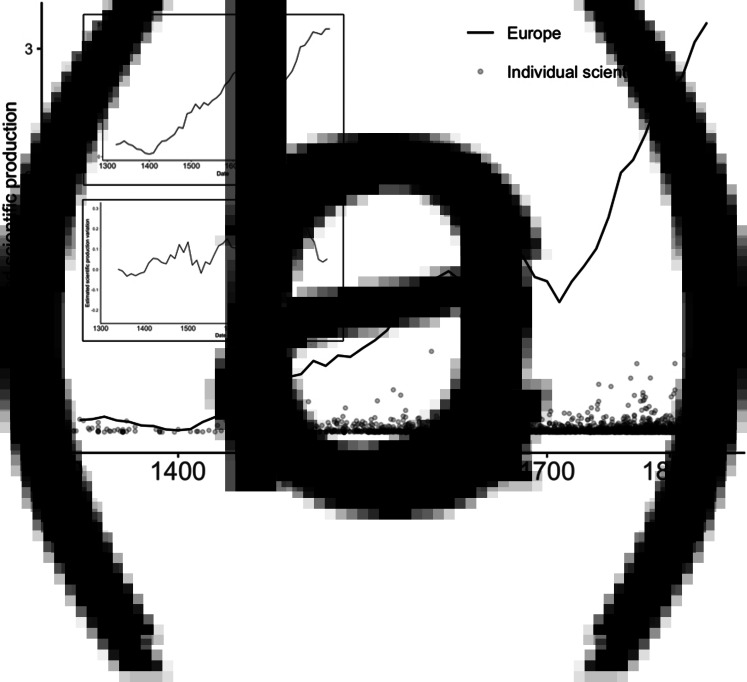
Figure 1.
Evolution of scientific production (1300–1850). A) Total scientific production. Black points represent individual scientists' estimated production. The black line represents the log-transformed aggregated scientific production, computed as the sum of the individual scientists estimated production., B) Scientific production per capita, C) Growth rate in scientific per capita.

