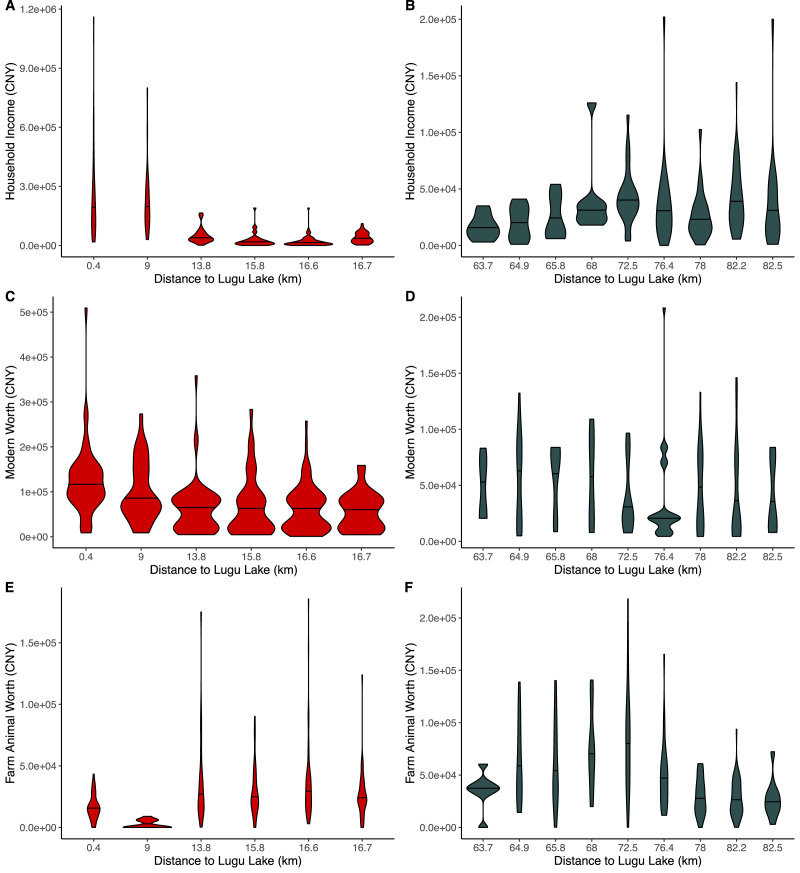
Figure 1.
Violin plots showing the distribution of various types of material wealth by predominant lineality (matrilineal, red; patrilineal, gry) and distance to the primary tourism cwithin the area corresponding to each lineality. Each violin plot corresponds to a single village. (a, b) Househld income; (c, d) modern sset worth; (e, f) farm anial worth. Note that the x-axis is not to scale and there is a difference in scales on the y-axis.

