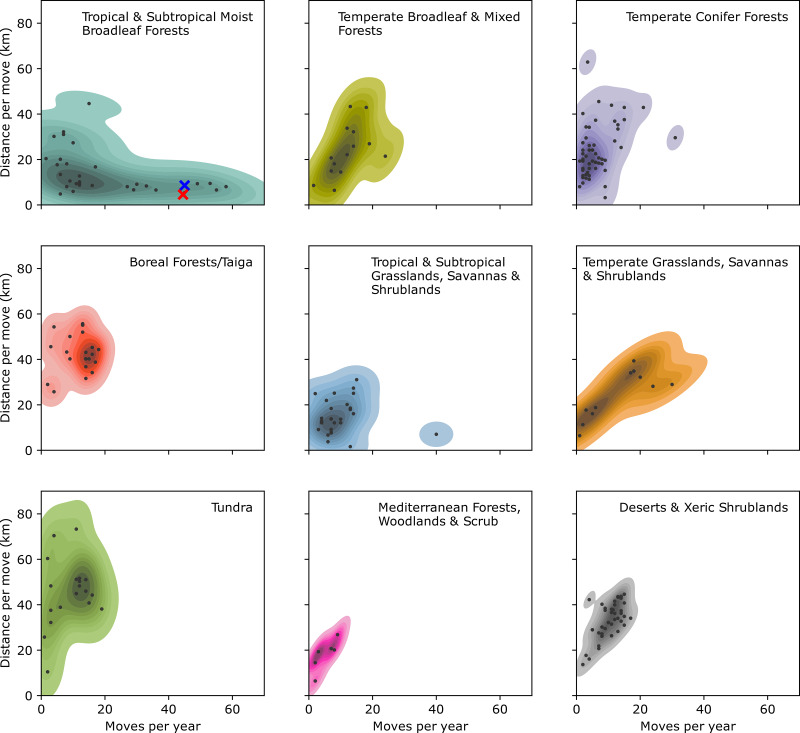
Figure 2.
Distribution of movements per year and movement distance for hunter–gatherer societies grouped by ecoregion, as reported in the Binford Hunter Gatherer dataset D-Place (2018a) and Kirby et al. (2016) (see Methods). The Punan Batu (top left, red cross) show a similar high frequency of movements but slightly reduced movement distance compared with mid-nineteenth century data on Western Penan communities (blue cross).

